先端基板スタートアップの量産DD:顧客認定・歩留まり・装置acceptanceをどう読むか
先端基板の発表を読むと、微細配線、低反り、高アスペクト比viaといった性能値が先に目に入る。だが投資判断で最初に聞くべき問いは「最高性能はいくつか」ではなく、同じ条件で何枚を作り、顧客がどの段階まで承認したかだ。
車載EEPROMの量産開発では、良好な断面写真が1枚得られても量産移行の根拠にはならなかった。lot間、装置間、材料lot間のばらつきを含め、規格内の製品を繰り返し作れることが必要だった。本稿はその考え方を、先端package substrateのDDに移す。
確認時点:2026年10月4日。 会社発表、IPC、NIST、米国商務省の一次資料を使用した。非公開の歩留まり、顧客名、単価、出荷量は推計しない。以下の歩留まり計算は工程感度を示す筆者シナリオであり、特定企業の実績ではない。

私が資料を開いた直後に作るのは、技術比較表ではなく証拠の階段である。
| 段階 | 見える証拠 | まだ言えないこと | 次の確認資料 |
|---|
| 1. coupon | SEM断面、抵抗、単一構造 | panel全体の均一性 | 測定点数、母数、分布 |
| 2. prototype | 実寸に近いtest vehicle | 顧客工程との互換性 | design rule、材料構成 |
| 3. qualification | 温度cycle、湿熱、電気試験 | 継続量産の採算 | 規格、条件、failure mode |
| 4. line acceptance | 顧客siteで装置・工程を受入 | repeat order、稼働率 | FAT/SAT、takt、uptime |
| 5. volume production | 複数lot、継続出荷、再発注 | 将来の利益率 | good-panel yield、ASP、材料消費 |
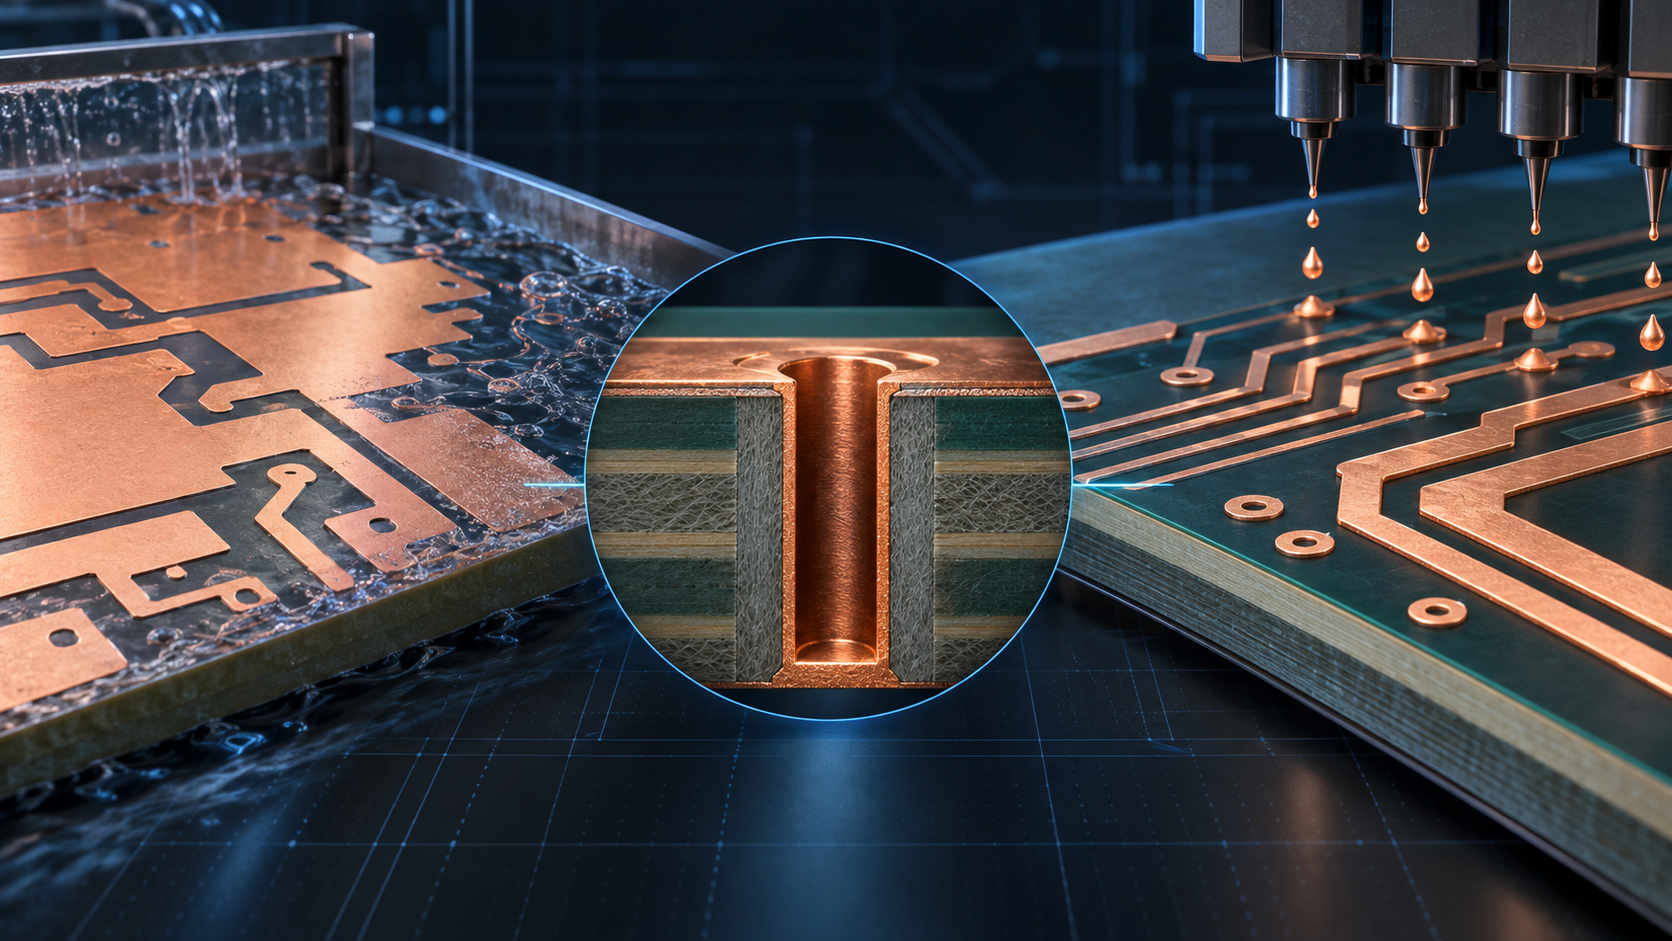
Elephantechの2026年4月27日発表は、15nm級銅nanoparticleをinkjetで高AR via内壁に付着させ、焼結後に通常のelectrochemical copper platingへつなぐ工程を示す。重要なのは、同社自身がmemoryメーカー、foundry、advanced packaging企業との「共同評価中」と記し、実silicon viaへの詳細評価を進めている点だ。これは段階1〜2の有力な証拠だが、段階5ではない。
一方、IPC-6012Fはrigid boardのqualificationとperformanceを規定し、microvia reliabilityを評価するtest coupon、microsection、hole registration、internal plated layerなどを扱う。規格名を満たしたという一語より、どの構造を、どのclass・条件で、何個試験したかを見る必要がある。
量産DDで違和感を覚えるのは、yieldが単一の数字で出てくるときだ。先端基板では、配線、via、積層、反り、検査、singulationが直列につながる。最終yieldだけでは原因が消える。
| 指標 | 最低限の分母 | DDでの質問 | 赤信号 |
|---|
| line/space defect | inspected areaまたは配線長 | open/shortを密度で比較したか | 良品写真だけ |
| via yield | via総数、径、AR | chain抵抗と断面を紐付けたか | via数が不明 |
| warpage | panel数、温度履歴 | 室温とreflow peakの両方か | 平均値のみ |
| reliability | sample数、cycle数 | failureまでの分布があるか | pass/failだけ |
| good-panel yield | 投入panel数 | rework、scrapを含むか | die単位との混同 |
NIST/IRDSの2024 metrology roadmapは、substrateでtopography/warpage、line width/spacing/pitch、film thickness、die attach coplanarity、via diameter、multilayer thermal measurement、package electrical testを必要項目に挙げる。つまり「低反り」だけでも「微細配線」だけでも十分ではない。
工程が直列になる影響を、再現可能な簡単な計算で見る。各critical stepの通過率を同じと仮定したシナリオである。
final_yield = step_yield ^ critical_steps

99.5% ^ 6  = 97.04%
99.5% ^ 12 = 94.16%
99.0% ^ 6  = 94.15%
99.0% ^ 12 = 88.64%
工程ごとの差、欠陥相関、reworkを無視した単純化だが、意味は明確だ。1工程の0.5ポイント差は小さく見えても、critical stepが12あると最終yieldは約5.8ポイント下がる。したがって「各工程99%以上」は安心材料にならない。工程別yield、母数、相関を要求する。
私はqualificationという語を、技術認定と購買認定に分ける。前者は試験条件を満たすこと、後者は顧客が設計・品質・供給・変更管理を含めて買える状態にすることだ。
| ゲート | 技術側の証拠 | 商流側の証拠 | よくある誤読 |
|---|
| material approval | TDS、lot traceability | approved vendor list | 材料評価=製品採用 |
| process qualification | coupon、reliability report | PCN、control plan | 規格pass=量産発注 |
| equipment acceptance | FAT、SAT、capability | 検収、保守契約 | 納入=売上認識済み |
| product qualification | test vehicle、system test | sourcing approval | sample出荷=design win |
| repeat order | 同条件の再発注 | 消耗材・service売上 | 初回PoC=継続収益 |
NISTはadvanced packagingで、従来の目視検査が使えない微細構造のreliability、test、repairを課題としている。さらにbondingのKnown Good Processはtrial and errorで作られており、surface pretreatment、pressure、time、temperature、annealを予測できるmetrologyが必要だとする。新材料を採用する顧客が慎重なのは、保守的だからではない。見えないinterface defectを量産中に検出しなければならないからだ。
Absolicsへの米国支援も同じ読み方ができる。2024年の商務省発表は最大7,500万ドルのnon-binding preliminary termsで、awardはdue diligenceとmilestone達成を条件とした。現在のNIST NAPMPページは、Absolics、Applied Materials、Arizona State Universityの3者に合計3億ドルのR&D awardがfinalizedされたと説明する。ただし、R&D awardは顧客のvolume purchase orderではない。公的支援、製造能力、顧客認定は別々の列で管理する。
売切り装置と消耗材を持つ会社では、売上の質が同じではない。装置納入後にacceptanceが遅れれば、売上認識も材料消費も後ろへずれる。
以下は開示がない場合に数値を埋めるモデルではなく、質問を揃えるための式である。
accepted_tools = shipped_tools × acceptance_rate
annual_material_revenue = accepted_tools × uptime × wafers_or_panels_per_hour
                        × operating_hours × material_per_unit × realized_price
| 変数 | 一次資料で探すもの | 感度が高い理由 |
|---|
| acceptance rate | shipmentとacceptanceの差 | 検収前は稼働・売上が確定しない |
| uptime | planned/unplanned downtime | 消耗材需要へ直結 |
| takt time | panel/hour | 能力増強の実効性を決める |
| material per unit | ink、chemistry、target交換 | recurring revenueを決める |
| repeat order interval | 2回目の発注時期 | PoCから量産への転換を示す |
ここで架空のASPや稼働率を置いてTAMを作るのは却下する。採用する方法は、四半期ごとにshipped、accepted、running、repeat orderedを別々に数えることだ。
現時点の判断は、先端基板テーマに中期ポジティブ、個別スタートアップの売上規模にはニュートラルである。AI packageの複雑化は追い風だが、良好な断面が量産利益へ変わるまでに複数のゲートがある。
| シナリオ | 観測条件 | 判断 | 反証条件 |
|---|
| メイン | qualification完了、限定line acceptance | 技術価値は認めるが売上を外挿しない | 母数・条件が非開示のまま |
| 上振れ | 複数顧客でSAT、repeat order、good-panel yield開示 | recurring modelを評価 | 単一顧客への集中 |
| 下振れ | coupon結果は良いが実panelで反り・via defect | pilot長期化を織り込む | process window拡大 |
| テールリスク | reliability failure、材料変更、顧客PCN停止 | 採用時期を白紙化 | failure mode閉鎖と再認定 |
検索では基板・memory wallを距離別に整理した記事に表示がある。材料別の詳細はElephantechの銅配線工程とガラスコアのTGV・反り・歩留まりで扱った。本稿の役割は、どの技術にも共通する証拠の読み方を固定することだ。
面談ごとに同じ質問を繰り返すと、説明の変化と工程の進捗を分けられる。最新の完了ゲート、次のゲートの責任者、pass criteria、試験母数、合格時の商流、失敗時の再試験条件を記録する。加えて、歩留まりの分母がcoupon、die、panelのどれか、測定がroom temperatureかreflow peakか、failureをreworkへ移していないかを固定欄にする。
三つのパターンは特に見逃しやすい。第一に、平均yieldは上がったがtail defectが残るケース。第二に、顧客の試験は通ったが装置SATが遅れるケース。第三に、装置は稼働したが消耗材のrepeat orderがないケースだ。技術、稼働、商流のどこで止まったかによって、追加資金の意味が変わる。
なお、工程が量産readyでも投資として強いとは限らない。価格交渉力、field service、working capitalが不足すれば成長は資金を消費する。逆に認定が長いだけで技術が弱いとも言えない。新材料stackでは顧客側の変更管理が時間を使う。重要なのは「遅い・速い」ではなく、どのgateが時間とcashを支配しているかを特定することだ。
結論は短い。pitch、AR、warpageのベスト値より先に、母数、分布、規格条件、line acceptance、repeat orderを確認する。スタートアップの価値は、段階1のcouponから段階5の継続量産へ、証拠がどれだけ速く、逆戻りせず移動しているかで測る。
次号の記事案
- 案1:装置acceptanceから消耗材売上を追跡する — shipped、SAT、uptime、材料交換周期を同じ表で追い、売切りと継続収益を分ける。
- 案2:microvia reliabilityの試験条件を比較する — IPC coupon、温度cycle、microsectionの条件差が結果へ与える影響を整理する。
- 案3:substrate yieldの開示テンプレート — panel、via、配線長の異なる分母を正規化し、企業間で誤比較しない表を作る。
本記事は情報提供を目的とし、特定銘柄や未上場株式の取得を推奨するものではありません。筆者が記載企業または関連企業の証券を保有する可能性があります。調査・執筆・翻訳に生成AIを利用しています。シナリオ計算は特定企業の実績や将来収益を示しません。詳細は免責事項をご確認ください。
Advanced-Substrate Startup Diligence: Reading Qualification, Yield and Equipment Acceptance
Advanced-substrate announcements naturally lead with fine line/space, low warpage, or high-aspect-ratio vias. The first investment question, however, is not “What is the best number?” It is: How many units were built under comparable conditions, and what exactly has the customer approved?
When I worked on automotive EEPROM production, one clean cross-section never justified a production release. The process had to repeat across lots, tools and material batches. This article transfers that discipline to advanced package-substrate diligence.
Checked on October 4, 2026. The evidence comes from company releases and primary material from IPC, NIST and the U.S. Department of Commerce. Undisclosed yield, customer names, pricing and shipment volumes are not estimated. The yield math below is an author scenario, not company performance.
My first worksheet is an evidence ladder, not a technology ranking.
| Level | Visible evidence | What it does not prove | Next document to request |
|---|
| 1. Coupon | SEM cross-section, resistance, one structure | Panel-level uniformity | Sample count and distribution |
| 2. Prototype | Near-product test vehicle | Customer-process compatibility | Design rules and stack-up |
| 3. Qualification | Thermal cycle, humidity, electrical test | Sustainable production economics | Standard, conditions, failure modes |
| 4. Line acceptance | Tool/process accepted at customer site | Repeat orders or utilization | FAT/SAT, takt time, uptime |
| 5. Volume production | Multiple lots, continuing shipments | Future margins | Good-panel yield, ASP, consumables |
Elephantech’s April 27, 2026 release describes a process in which 15-nm-class copper nanoparticles are inkjet-deposited on high-AR via walls, sintered, then connected to conventional electrochemical copper plating. The key wording is that collaborative evaluation is underway with memory manufacturers, foundries and advanced-packaging companies, with detailed work moving toward actual silicon vias. That is valuable Level 1–2 evidence, not Level 5.
IPC-6012F establishes qualification and performance requirements for rigid boards and expands coverage of microvia reliability, test coupons, microsection evaluation, registration and internal plated layers. A claim of “IPC compliance” still needs construction, class, condition and sample count.
I become cautious when a substrate company reports yield as one number. Interconnect patterning, vias, lamination, warpage, inspection and singulation are serial steps. A final number hides where learning is occurring.
| Metric | Minimum denominator | Diligence question | Red flag |
|---|
| Line/space defects | Inspected area or trace length | Are opens/shorts normalized by density? | Only a good image |
| Via yield | Total vias, diameter and AR | Are chain resistance and sections linked? | Unknown via count |
| Warpage | Panel count and thermal history | Room temperature and reflow peak? | Mean only |
| Reliability | Samples and cycles | Is time-to-failure distributed? | Pass/fail only |
| Good-panel yield | Input panels | Are rework and scrap included? | Confused with die yield |
The NIST/IRDS metrology roadmap names topography and warpage, line width/spacing/pitch, film thickness, die-attach coplanarity, via diameter, multilayer thermal measurement and package electrical test as substrate needs. Fine lines alone—or low warpage alone—do not close qualification.
The compounding effect is easy to reproduce. Assume identical pass rates only to expose sensitivity:
final_yield = step_yield ^ critical_steps

99.5% ^ 6  = 97.04%
99.5% ^ 12 = 94.16%
99.0% ^ 6  = 94.15%
99.0% ^ 12 = 88.64%
This ignores unequal steps, correlated defects and rework. It still shows why “every step is above 99%” is not enough. Twelve critical steps at 99% produce only 88.64% before those complications. Ask for step-level distributions and denominators.
I split qualification into two tracks. Technical qualification proves performance under stated conditions. Purchasing qualification proves the customer can buy, control changes, secure supply and operate the process.
| Gate | Technical evidence | Commercial evidence | Common misread |
|---|
| Material approval | TDS and lot traceability | Approved-vendor status | Material test equals product adoption |
| Process qualification | Coupons and reliability report | PCN and control plan | Standard pass equals production PO |
| Equipment acceptance | FAT, SAT and capability | Acceptance and service contract | Shipment equals recognized revenue |
| Product qualification | Test vehicle and system test | Sourcing approval | Sample equals design win |
| Repeat order | Same-condition reorder | Consumables/service revenue | Initial PoC equals recurring revenue |
NIST highlights reliability, test and repair as unresolved challenges when tightly packed structures cannot be inspected conventionally. Its bonding project also notes that Known Good Processes are often developed by trial and error; surface pretreatment, pressure, time, temperature and anneal need predictive metrology. Customers are not slow merely because they are conservative. They must detect buried interface defects in production.
Public funding belongs in a separate evidence column. The 2024 Commerce release described up to $75 million of non-binding preliminary terms for Absolics, conditional on due diligence and milestones. NIST’s current NAPMP page says $300 million of R&D awards have been finalized across Absolics, Applied Materials and Arizona State University. That is real program evidence, but an R&D award is not a customer volume purchase order.
For a company selling equipment plus consumables, shipment, acceptance and running status are different events. Delayed acceptance can delay both revenue recognition and material consumption.
accepted_tools = shipped_tools × acceptance_rate
annual_material_revenue = accepted_tools × uptime × wafers_or_panels_per_hour
                        × operating_hours × material_per_unit × realized_price
| Variable | Primary evidence to seek | Why it matters |
|---|
| Acceptance rate | Gap between shipment and acceptance | No proven operation before acceptance |
| Uptime | Planned and unplanned downtime | Direct driver of consumables |
| Takt time | Panels per hour | Determines effective capacity |
| Material per unit | Ink, chemistry or target replacement | Determines recurring revenue |
| Repeat-order interval | Timing of the second order | Marks PoC-to-production conversion |
I reject filling this model with fictional ASP or utilization assumptions to create a TAM. The useful practice is to track shipped, accepted, running and repeat-ordered tools separately each quarter.
My view is medium-term positive on advanced substrates but neutral on extrapolating individual startup revenue. AI packaging complexity is a real tailwind, yet multiple gates stand between a good cross-section and production profit.
| Scenario | Observable condition | Call | Disconfirming evidence |
|---|
| Main | Qualification plus limited line acceptance | Recognize technology value; do not extrapolate sales | Missing denominator and conditions |
| Upside | SAT at multiple customers, repeat orders, disclosed good-panel yield | Underwrite recurring model | Single-customer concentration |
| Downside | Good coupon; warpage/via defects on real panels | Extend pilot timeline | Wider process window |
| Tail risk | Reliability failure, material change, customer PCN stop | Reset adoption timing | Closed failure mode and requalification |
Search visibility for this cluster currently reaches the substrate-and-memory-wall map. The material-specific evidence sits in the Elephantech copper-process review and the glass-core TGV, warpage and yield analysis. This article supplies the common evidence framework.
Repeating the same questions each quarter separates a changing narrative from a changing process. I record the latest completed gate, the accountable owner for the next gate, its written pass criteria, the test population, the commercial event triggered by a pass, and the retest rule after a failure. I also freeze the denominator: coupon, die, panel, inspected area, trace length or total via count. Without that field, a reported yield improvement can simply reflect a change in what was counted.
The log needs the measurement context as well. Warpage at room temperature is not equivalent to warpage near reflow peak. A chain-resistance result does not replace destructive cross-sectioning, and a selected SEM image does not describe a distribution. For reliability, I want the stress profile, sample size, censored samples, time or cycles to failure, and the observed failure mode. For equipment, I separate factory acceptance from site acceptance, then record planned and unplanned downtime after the tool enters service.
Three patterns deserve special attention. First, the mean yield improves while a long defect tail remains; this can leave expensive panels exposed to rare but catastrophic loss. Second, customer coupons pass while SAT slips because automation, contamination control or upstream/downstream integration is not ready. Third, the tool runs but the consumables order does not repeat, suggesting low utilization, inventory loading or a process change. Each pattern points to a different cash requirement and a different technical owner.
The evidence log should include negative results. A failed gate with a closed failure mode, revised control plan and successful requalification can be more informative than an uninterrupted sequence of carefully selected successes. Management teams that disclose how the process failed—and what measurement changed afterward—give investors a way to test learning velocity. Silence forces the investor to price a wider uncertainty range.
Finally, production readiness is not identical to investment quality. A technically capable supplier can still lack pricing power, field-service coverage, second-source resilience or working capital. Rapid growth may consume cash if tools are built before acceptance or if consumables are stocked at customer sites before usage. Conversely, long qualification does not automatically imply weak technology; an entirely new material stack can move slowly because the customer’s change-control burden is high. The point of the framework is not to label progress as fast or slow. It is to identify which gate controls time, cash and risk, then update that gate with observable evidence.
That discipline also prevents a strong market narrative from outrunning the manufacturing record when capital needs are largest and evidence remains scarce.
The conclusion is deliberately narrow. Before comparing best pitch, AR or warpage, verify denominator, distribution, standard conditions, line acceptance and repeat orders. A startup’s de-risking is the speed at which evidence moves from a Level 1 coupon to Level 5 repeat production without moving backward.
This framework also changes how I conduct management interviews. I no longer ask a broad question such as “When will you reach mass production?” That wording invites an answer built around the company’s preferred definition. I ask for the date and output of the latest completed gate, the owner of the next gate, its pass criteria, the population being tested, and what happens commercially if it passes. I then request the same sequence for the preceding quarter. The comparison exposes whether evidence is accumulating or whether the narrative is moving while the process remains stationary.
There is one more boundary worth preserving. A production-ready process can still be a weak investment if the supplier lacks pricing power, service capacity or working capital. Conversely, slow qualification does not automatically mean weak technology; customers may be qualifying an entirely new material stack. The diligence model therefore does not issue a binary verdict. It identifies the exact gate that controls time, cash and technical risk, so the next observation can update the thesis without inventing a revenue forecast.
Next Issue Ideas
- Idea 1: From equipment acceptance to consumables revenue — Track shipment, SAT, uptime and replacement intervals without mixing one-time and recurring revenue.
- Idea 2: Comparing microvia reliability conditions — Map IPC coupons, thermal cycles and microsection rules to show why nominally similar results differ.
- Idea 3: A disclosure template for substrate yield — Normalize denominators across panels, vias and inspected trace length before comparing vendors.
This article is for informational purposes only and is not a recommendation to acquire any listed or private security. The author may hold securities of named or related companies. Generative AI assisted research, drafting and translation. Scenario calculations are not reported company performance or forecasts. See the disclaimer for details.