ガラスコア基板の量産課題:TGV・反り・歩留まりを同じ物差しで読む
ガラスコア基板は「有機基板より反りにくい」と説明されることが多い。だが、量産性を決めるのは材料の平坦性だけではない。TGVの穴あけと金属化、ガラス端面の欠け、積層後の反り、パネル内の位置精度、良品面積あたりのコストが連鎖し、最後の1工程でそれまでの利点を消すこともある。
先に結論を示す。2026年9月時点で、ガラスの物性上の利点、試作基板、pilot line、公的なR&D・工場支援は確認できる。一方、複数顧客にまたがる量産歩留まり、TGV欠陥分布、修理率、良品パネル当たりコストは公開資料から確認できない。したがって、「ガラスが有望」と「量産が成立した」は分けて扱うべきだ。
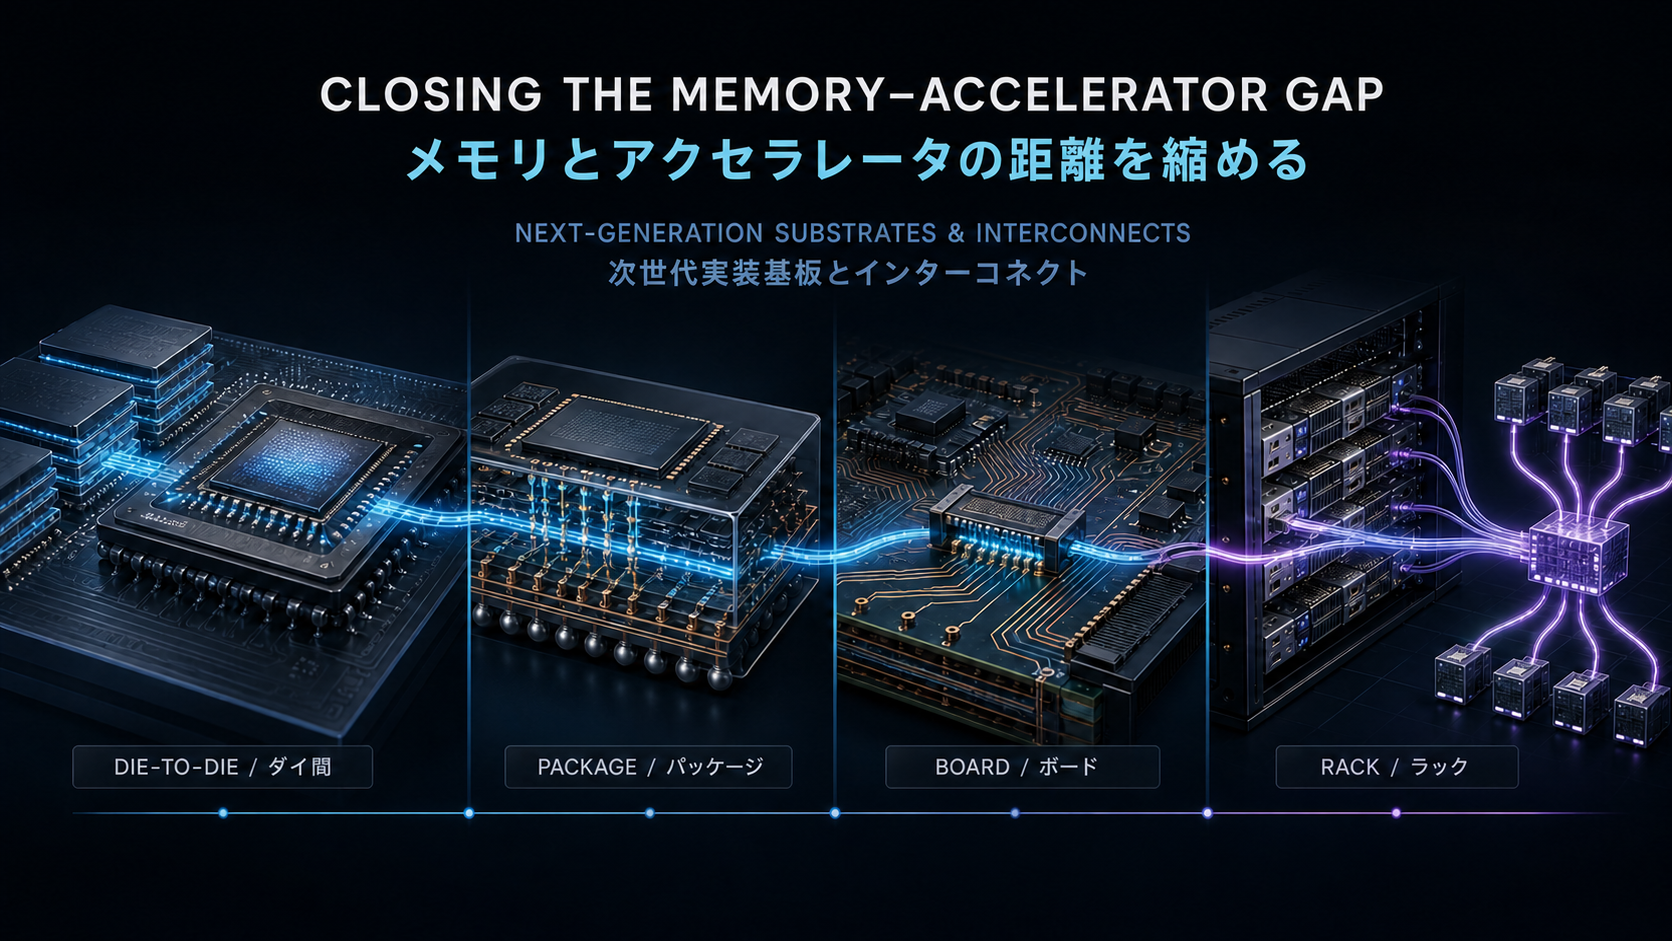
実装基板全体の地図ではガラスコアをパッケージ階層に置いた。本稿はそこから一段深く、量産ボトルネックだけを扱う。銅seed形成の違いはElephantechの工程比較、基板・bonding・testの開示を追う方法はメモリ後工程バリューチェーンに接続する。
確認時点:2026年9月17日。 数値はIntel、NIST、Samsung Electro-Mechanics、Corningの公式資料に基づく。各社の性能表現は会社発表であり、横並びの第三者試験ではない。計算値は本稿の仮定によるシナリオで、製品歩留まりの推定ではない。

私には、材料名ではなく証拠の段階を揃えることが最も重要に見える。
| 論点 | 現在確認できること | まだ確認できないこと |
|---|
| 反り | Intelは有機材料比でpattern distortion 50%減を主張。Corningはcarrierで工程内warp最大40%減を掲示 | 同一package構造・温度履歴での量産比較 |
| TGV | Corningは精密via付きglass、Samsungは微細channel形成とmetal fillを公式展示 | panel全面のvia欠陥分布、repair率、takt time |
| 生産段階 | SamsungはSejong pilot lineでprototype、JV量産は2027年以降を計画 | 複数顧客のproduction qualificationと継続出荷 |
| 公的支援 | NISTはAbsolics SMART Packagingへ1億ドルのR&D支援を確定 | 支援額から逆算した売上、利益、量産歩留まり |
この表の要点は、優れた材料特性、設備投資、顧客評価、量産良品率が別の指標だということだ。
大型packageでは、配線密度だけでなくlayer間の位置合わせが先に限界になることがある。
有機coreは温度と吸湿で寸法が動き、packageが大きくなるほど局所差がoverlay errorへ現れやすい。ガラスは高い剛性、低いwarp、調整可能なCTE、低い高周波損失を組み合わせられる。Intelはglass substrateについて、有機材料に対してpattern distortionを50%減らし、interconnect densityを最大10倍にできる可能性を示した。ただし、これはIntelの将来技術に関する主張であり、10倍の出荷量や10倍の歩留まりを意味しない。
Corningはsemiconductor glass waferでCTE 3.2〜12.4ppm/°C、100µmまでの薄型化、waferとpanel form factorを示している。ここで注意したいのは、temporary carrier glassと最終製品のglass core substrateは同じではないことだ。carrierの「warp最大40%減」を、そのままpackage coreの量産値に転記することはできない。
| 項目 | 有機coreで顕在化しやすい課題 | glass coreの狙い | 新たに増える管理点 |
|---|
| 大面積化 | 熱・吸湿による寸法変化、反り | 高剛性、平坦性、CTE調整 | 脆性、edge chip、handling |
| 微細配線 | layer間overlay余裕が縮小 | 寸法安定性で微細化余地 | glass表面処理、密着性 |
| 垂直接続 | core viaの径・pitch制約 | TGVで短い垂直接続 | 穴形状、metallization void |
| 高速信号 | dielectric lossと長い配線 | glassの低損失特性 | via transitionのSI検証 |
採用案は、同じ温度履歴・同じpackage寸法で反りとoverlayを比較すること。却下案は、材料datasheetのCTEだけで完成品歩留まりを予測することだ。
CTE差はppm/°Cのままだと実感しにくい。そこで100mmの長さ、220°Cの温度差を仮定し、CTE差が1、5、10ppm/°Cのときの自由熱膨張の相対変位を計算する。さらにCorningが例示するpanel面積を300mm waferの円面積と比べる。
from math import pi

DELTA_T_C = 220
LENGTH_MM = 100

for delta_cte_ppm in (1, 5, 10):
    strain = delta_cte_ppm * 1e-6 * DELTA_T_C
    relative_shift_um = strain * LENGTH_MM * 1_000
    print(delta_cte_ppm, round(strain * 100, 3), round(relative_shift_um, 1))

wafer_300_area = pi * 150**2
for width, height in ((515, 510), (600, 600)):
    panel_area = width * height
    print(f"{width}x{height}", round(panel_area / wafer_300_area, 2))
| 仮定したCTE差 | 熱ひずみ | 100mmでの自由相対変位 |
|---|
| 1ppm/°C | 0.022% | 22µm |
| 5ppm/°C | 0.110% | 110µm |
| 10ppm/°C | 0.220% | 220µm |
515×510mm panelのgross areaは300mm wafer円面積の約3.72倍、600×600mmなら約5.09倍になる。しかし、これは面積だけの比較だ。edge exclusion、street、欠け、via不良、再配線不良を入れていないので、良品数やコスト優位を示さない。むしろ、panelの面積利点を得るには面内均一性を同時に証明する必要がある、と読むべきだ。
私が最も警戒するのは、「viaが1個できた」という断面写真を「panelが量産できる」に読み替えることだ。
TGV工程は、穴形成、cleaning、表面活性化、seed形成、metal fillまたはconformal plating、平坦化、RDL接続へ続く。via底の未被覆、側壁void、銅とglassの界面剥離、thermal cycle後のcrackは、それぞれ別のfailure modeである。Samsung Electro-Mechanicsは2026年の展示でglassへの微細channel形成、metal fill、精密surface processingを紹介したが、公開資料はpanel yieldやsample sizeを示していない。
| 工程 | 代表的な不良 | 量産で必要な観測値 | 断面写真だけで分からないこと |
|---|
| Glass handling | edge chip、microcrack、破損 | breakage率、edge exclusion、搬送停止 | 後工程での遅延破壊 |
| TGV形成 | taperばらつき、位置ずれ、残渣 | via径分布、位置精度、穴形成takt | 全面均一性 |
| Metallization | void、seed discontinuity、overburden | daisy-chain抵抗分布、void率 | temperature cycle寿命 |
| Build-up / RDL | 密着不良、overlay error、反り | layer別yield、warpage map、rework率 | good-panel cost |
| Singulation / Assembly | crack、bump open、局所反り | good-unit yield、assembly escape | 顧客systemでの信頼性 |
歩留まりは各工程の積になる。仮に5工程がすべて99%でも累積は約95.1%だが、これは説明用の算術であり、glass基板の実績ではない。各工程が独立でも一定でもないため、公開された1工程のpassを全体yieldへ変換してはいけない。
用語の混同も大きい。carrierは加工中にwaferやpanelを支える仮固定材、core substrateは最終packageの基盤、interposerはchipとsubstrateの間に置く高密度配線層である。NISTのsubstrate programは、chipとの間にinterposerを置かず直接接続を支えるbase layerとしてsubstrateを定義している。企業資料を比較するときは、どの階層のglassかを最初に固定したい。
もう一つの落とし穴は、公的資金をcommercial tractionとみなすことだ。NISTのAbsolics向け1億ドルはSMART PackagingのR&Dとecosystem形成を支える。別に米商務省は工場向け最大7,500万ドルを確定した。これは技術・供給網の重要性を示すが、顧客の量産acceptanceや利益率を証明しない。
発表を追うなら、年次計画より証拠の質を上げる出来事に注目したい。
Samsung Electro-MechanicsはSejongのpilot lineでprototypeを製造し、Sumitomo Chemical groupとのJVで2027年以降の量産開始を計画している。2026年9月のKPCA Showではglass substrateを展示した。これらは「材料研究だけ」より進んだ証拠だが、production qualification完了の証拠ではない。Intelも市場投入を2020年代後半と表現しており、具体的な顧客製品、volume、yieldは公式発表にない。
| 証拠段階 | 公開例 | 次に必要な証拠 | 投資判断でしてはいけない推論 |
|---|
| 材料特性 | CTE range、低loss、flatness | lot間ばらつき、表面品質 | 材料が良いから量産可能 |
| Test vehicle | TGV断面、電気接続、package試作 | sample数、failure distribution | 1断面からpanel yieldを推定 |
| Pilot line | Samsung Sejongでprototype | takt、uptime、rework、good-panel yield | pilot稼働を量産売上とみなす |
| Customer qualification | sample promotion、評価 | qualification完了、仕様凍結 | 評価開始をdesign winと呼ぶ |
| Volume production | 2027年以降の計画 | 出荷量、継続発注、複数顧客 | 計画年を確定売上に置換 |
採用案は、via分布、warpage map、良品panel yield、equipment uptime、顧客qualificationを同じ四半期表で追うこと。却下案は、展示会の「量産予定」だけで供給量や売上を置くことだ。
現時点では、量産速度を決める変数を分離した条件付きシナリオが妥当だ。
| シナリオ | 条件 | 確認する一次情報 | 見方を変える条件 |
|---|
| Base | pilotと顧客sampleが継続、量産は限定 | prototype更新、JV設立、qualification状況 | 日程延期が繰り返される |
| Main | 1用途でqualificationを終え、限定volumeへ | 顧客用途、出荷開始、良品yieldの範囲 | panel欠陥やassemblyでcost優位が消える |
| Upside | 複数顧客・複数packageへ展開 | repeat order、capacity拡張、複数lot data | 1顧客・1構造へ集中する |
| Tail risk | crack、TGV、warpageのどれかが律速 | 仕様変更、追加test、設備改造 | 独立顧客で同条件の採用が確認される |
結論は限定的だ。glass coreは、大型AI packageの反りと微細配線を同時に扱う有力な材料選択肢である。ただし、勝負は「glassを作れるか」ではなく、「大面積panel上でTGVとbuild-upを均一に作り、assembly後まで良品を残せるか」に移っている。次の有用な開示は、最大性能値より分布、sample数、継続lot、良品面積当たりcostだ。
次号の記事案
- 案1:ガラスとABFのseed形成比較 — PVD、無電解銅、銅nanoinkを、step coverage、密着、repairの同じ条件で比較する。
- 案2:TGV量産DDテンプレート — via径分布、daisy-chain、temperature cycle、panel mapをsupplierへ確認する質問表に落とす。
- 案3:glass substrate設備・材料watchlist — laser drilling、metrology、plating、handlingの各工程で、受注とacceptanceを重複なく追う。
本記事は情報提供を目的とし、特定銘柄や未上場株式の取得を推奨するものではありません。筆者が記載企業または関連企業の証券を保有する可能性があります。調査・執筆・翻訳に生成AIを利用しています。計算は明示した仮定に基づき、製品性能、量産歩留まり、投資収益を保証しません。詳細は免責事項をご確認ください。
Glass-Core Substrate Manufacturing: Comparing TGV, Warpage, and Yield on One Evidence Scale
Glass-core substrates are often summarized as “less prone to warpage than organic substrates.” That is directionally useful, but it is not a manufacturing conclusion. TGV drilling and metallization, glass-edge damage, post-lamination warpage, panel-wide overlay, and cost per good area form a serial process. A late defect can erase an earlier material advantage.
The direct answer as of September 2026 is bounded. Public sources support the material case, functional test vehicles, pilot-line prototypes, and government support for R&D and manufacturing. They do not disclose multi-customer production yield, the distribution of TGV defects, repair rates, or cost per good panel. “Glass is promising” and “volume manufacturing is qualified” remain separate claims.
The substrate landscape article places glass core at the package layer. This article goes one level deeper into its manufacturing bottlenecks. For seed formation and via coverage, see the Elephantech process comparison. For a broader view of substrates, bonding, and test evidence, see the memory back-end value chain.
Verification date: September 17, 2026. Figures come from official Intel, NIST, Samsung Electro-Mechanics, and Corning material. Company performance statements are not cross-vendor independent tests. Article calculations are scenarios based on stated assumptions, not estimates of product yield.
In my view, the most useful discipline is to align the maturity of the evidence before comparing materials or vendors.
| Issue | What is currently visible | What remains undisclosed |
|---|
| Warpage | Intel claims 50% less pattern distortion than organic material; Corning advertises up to 40% lower in-process warp for carriers | Matched production comparison using the same package structure and thermal history |
| TGV | Corning offers precision-via glass; Samsung has shown fine channels, metal fill, and precision surface processing | Panel-wide via defect distribution, repair rate, and takt time |
| Manufacturing stage | Samsung makes prototypes on its Sejong pilot line and plans JV production after 2027 | Multi-customer production qualification and recurring shipments |
| Public support | NIST finalized a $100 million R&D award for Absolics’ SMART Packaging program | Revenue, profit, or production yield inferred from the award |
The key distinction is that material capability, capital deployment, customer evaluation, and production yield are different metrics.
For large packages, layer-to-layer alignment can become a constraint before nominal routing density does.
Organic cores change dimensions with temperature and moisture. As a package grows, local movement has more room to become overlay error. Glass combines stiffness, low warpage, tunable coefficient of thermal expansion, and low high-frequency electrical loss. Intel states that its glass-substrate technology can provide 50% less pattern distortion and potentially 10 times the interconnect density of organic material. Those are Intel’s technology claims; they do not mean ten times the shipment volume or ten times the production yield.
Corning lists semiconductor glass compositions spanning 3.2–12.4ppm/°C, thickness down to 100µm, and both wafer and panel formats. A critical boundary is often missed: temporary carrier glass is not the same product as the glass core left inside a finished package. Corning’s statement of up to 40% lower in-process warp for a carrier cannot be copied into a package-core yield model.
| Dimension | Organic-core pressure point | Glass-core objective | Additional control point |
|---|
| Large area | Thermal and moisture movement, warpage | Stiffness, flatness, tunable CTE | Brittleness, edge chips, handling |
| Fine routing | Shrinking layer-to-layer overlay margin | More stable fine-feature platform | Surface treatment and adhesion |
| Vertical connection | Core-via diameter and pitch | Short vertical paths through TGV | Hole geometry and metallization voids |
| High-speed signal | Dielectric loss and longer traces | Low-loss glass characteristics | Signal integrity through via transitions |
Adopted approach: compare warpage and overlay under the same package size and thermal history. Rejected approach: predict finished-package yield from a material CTE datasheet alone.
A CTE difference stated in ppm/°C is hard to visualize. The following calculation assumes a 100mm length and a 220°C temperature swing. It computes free relative movement for CTE differences of 1, 5, and 10ppm/°C. It also compares the gross areas of Corning’s example panel formats with a 300mm circular wafer.
from math import pi

DELTA_T_C = 220
LENGTH_MM = 100

for delta_cte_ppm in (1, 5, 10):
    strain = delta_cte_ppm * 1e-6 * DELTA_T_C
    relative_shift_um = strain * LENGTH_MM * 1_000
    print(delta_cte_ppm, round(strain * 100, 3), round(relative_shift_um, 1))

wafer_300_area = pi * 150**2
for width, height in ((515, 510), (600, 600)):
    panel_area = width * height
    print(f"{width}x{height}", round(panel_area / wafer_300_area, 2))
| Assumed CTE difference | Thermal strain | Free relative movement across 100mm |
|---|
| 1ppm/°C | 0.022% | 22µm |
| 5ppm/°C | 0.110% | 110µm |
| 10ppm/°C | 0.220% | 220µm |
A 515×510mm panel has about 3.72 times the gross area of a 300mm circular wafer; a 600×600mm panel has about 5.09 times. This is only an area comparison. It excludes edge keep-out, streets, breakage, via defects, and redistribution-layer defects, so it proves neither good-unit count nor cost advantage. The useful conclusion is narrower: capturing the panel-area opportunity requires panel-wide uniformity at the same time.
The relative-movement calculation is also deliberately not a warpage model. A real stack constrains its layers; elastic modulus, layer thickness, copper distribution, cure shrinkage, moisture, and the temperature-dependent properties of every material determine the final curvature and stress. The scenario is useful because it exposes scale. A CTE mismatch that sounds small in ppm can translate into tens or hundreds of micrometers across a large package before constraint is considered. That is already comparable with the dimensional budget of fine routing and assembly features. Any supplier comparison should therefore report the full stack, package dimensions, measurement temperature, and warpage convention rather than one room-temperature flatness value.
The claim I treat with the most caution is a cross-section of one via being translated into a volume-ready panel.
A TGV flow proceeds through hole formation, cleaning, surface activation, seed formation, metal fill or conformal plating, planarization, and connection to the redistribution layer. Missing coverage at a via bottom, sidewall voids, copper-glass delamination, and cracks after thermal cycling are different failure modes. Samsung Electro-Mechanics used its 2026 exhibition to show fine-channel formation in glass, metal filling, and precision surface processing. The release did not provide panel yield or sample size.
| Step | Representative defect | Production metric needed | What one cross-section cannot show |
|---|
| Glass handling | Edge chip, microcrack, breakage | Breakage rate, edge exclusion, tool stops | Delayed failure downstream |
| TGV formation | Taper variation, placement error, residue | Diameter distribution, placement accuracy, takt | Panel-wide uniformity |
| Metallization | Void, seed discontinuity, overburden | Daisy-chain resistance distribution, void rate | Thermal-cycle lifetime |
| Build-up / RDL | Adhesion failure, overlay error, warpage | Yield by layer, warpage map, rework rate | Cost per good panel |
| Singulation / assembly | Crack, bump open, local warpage | Good-unit yield, assembly escapes | Reliability in the customer system |
Yields multiply across steps. If five steps were each 99%, the arithmetic product would be about 95.1%. That is an illustration, not a reported glass-substrate result. Process yields are not necessarily independent or constant, which is why a pass at one step must not be converted into total production yield.
The distribution matters as much as the average. A panel can show an acceptable mean via resistance while a local cluster near one edge creates assembly escapes. The same applies to warpage: a single peak-to-valley number may hide local curvature under a large chiplet or HBM site. Useful production evidence would pair a spatial map with lot count, sample count, measurement repeatability, and the disposition of failed panels. Without those fields, two vendors can use the same words—“TGV qualified” or “low warpage”—for materially different evidence packages.
Terminology creates another source of false comparisons. A carrier temporarily supports a wafer or panel during processing. A core substrate remains as the package foundation. An interposer is a high-density routing layer between chips and the substrate. NIST defines the substrate targeted by its program as the base layer supporting direct chip connection, chip-to-chip communication, and power delivery without an intermediate interposer. Every comparison should first identify which layer of glass the source describes.
Government support is also not commercial traction. NIST’s $100 million award supports Absolics’ SMART Packaging R&D and ecosystem development. Separately, the U.S. Department of Commerce finalized up to $75 million for a manufacturing facility. These decisions demonstrate strategic and supply-chain importance, but they do not establish customer acceptance, margin, or production yield.
Instead of tracking target years alone, I would track events that raise the quality of the evidence.
Samsung Electro-Mechanics says it is producing prototypes on a Sejong pilot line and plans to begin production through a joint venture with the Sumitomo Chemical group after 2027. It displayed glass-substrate technology at KPCA Show in September 2026. This is stronger evidence than a material research concept, but it is not evidence that production qualification is complete. Intel similarly describes market delivery in the latter half of the decade without disclosing a customer product, volume, or yield.
| Evidence stage | Public example | Evidence needed next | Invalid investment inference |
|---|
| Material property | CTE range, low loss, flatness | Lot variation and surface quality | Good material automatically means manufacturable |
| Test vehicle | TGV cross-section, electrical path, package sample | Sample count and failure distribution | Estimate panel yield from one section |
| Pilot line | Samsung Sejong prototypes | Takt, uptime, rework, good-panel yield | Treat pilot operation as production revenue |
| Customer qualification | Sample promotion and evaluation | Qualification completion and frozen specification | Call evaluation a design win |
| Volume production | Production plan after 2027 | Shipment volume, repeat orders, multiple customers | Convert a target year into contracted revenue |
Adopted approach: place via distributions, warpage maps, good-panel yield, equipment uptime, and customer qualification in one quarterly evidence table. Rejected approach: derive supply volume or revenue from the words “mass-production plan” in an exhibition release.
A conditional scenario framework is more defensible than assigning a single adoption year.
| Scenario | Condition | Primary evidence to watch | What changes the view |
|---|
| Base | Pilot work and customer samples continue; volume remains limited | Prototype updates, JV formation, qualification status | Repeated schedule delays |
| Main | One application completes qualification and enters limited volume | Customer use, shipment start, disclosed yield range | Panel or assembly defects erase the cost case |
| Upside | Multiple customers and package types adopt | Repeat orders, capacity expansion, multi-lot data | Concentration remains in one customer or structure |
| Tail risk | Crack, TGV, or warpage becomes the limiting step | Specification changes, added tests, equipment modifications | Comparable adoption by independent customers |
The conclusion is intentionally narrow. Glass core is a credible material option for addressing both warpage and routing density in large AI packages. The decisive question has shifted from whether glass can be fabricated to whether TGV and build-up layers can be produced uniformly across a large panel while preserving good units through assembly. Distribution data, sample counts, consecutive lots, and cost per good area will be more useful than another maximum-performance figure.
Next Issue Ideas
- Idea 1: Seed Formation on Glass vs. ABF — Compare PVD, electroless copper, and copper nanoink under matched conditions for step coverage, adhesion, and repair.
- Idea 2: A Production-Diligence Template for TGV — Turn via-diameter distributions, daisy chains, thermal cycling, and panel maps into a supplier question set.
- Idea 3: Glass-Substrate Equipment and Materials Watchlist — Track orders and acceptance separately across laser drilling, metrology, plating, and handling.
This article is for informational purposes and is not a recommendation to buy any listed or private security. The author may hold securities issued by companies mentioned here or related companies. Generative AI assisted research, drafting, and translation. Calculations use stated assumptions and do not guarantee product performance, production yield, or investment returns. See the full disclaimer.