律速は演算ではなく電力:AIの電力ボトルネックとパワー半導体・系統インフラの投資地図
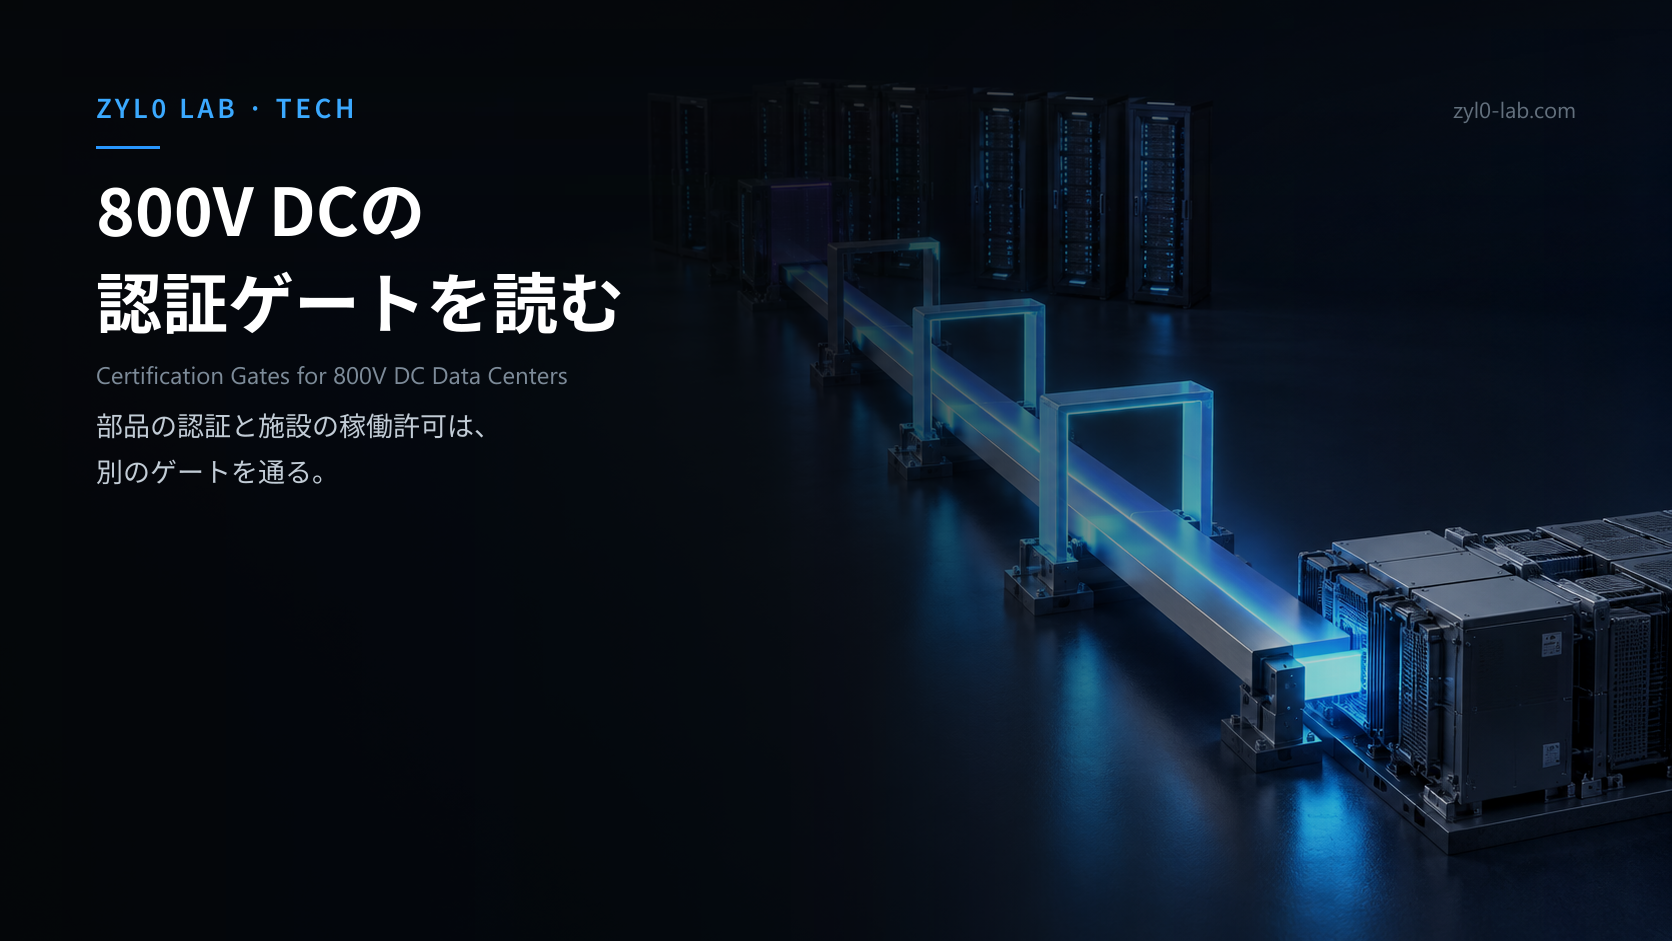
AI電力投資を比較する際は、発電・系統接続、構内配電、ラック内の変換を分けて読む必要がある。800V化が改善するのは主に電力を届ける経路で、発電容量そのものではない。GaNとSiCの役割や効率改善の金額効果は、続編の800V DC配電とパワー半導体の比較で計算条件とともに整理した。
Search Consoleの2026年8月28日〜9月24日では、本ページが3クリック/158表示(単純計算CTR約1.9%)だった。変換段の先にある突入・短絡・枝の選択遮断は別の保護課題なので、800Vラック保護の設計例でTIの公開試験条件を確認したい。
2026年9月1日、ノースカロライナ州チャペルヒルで開かれたG20イノベーション閣僚会合を、正直そこまで注目していなかった。仮想登壇したイーロン・マスクの発言がSNSで流れてきて、初めて手を止めた。「AIの電力危機はすでに起きている。遠い先の話ではない」。この一文を読んだ瞬間に頭に浮かんだのは半導体でもモデルの性能でもなく、前職CVCで系統連系のタイミング一つで投資仮説が根本から崩れかけた案件のことだった。
電力というテーマは地味だ。GPUの世代交代や新モデルのベンチマーク合戦に比べるとニュースになりにくい。だが#19で「シリコン周辺」の投資地図を描いたとき、電源・冷却・光・サイトの4セグメントのうち、いちばん解決が遠いと感じていたのが電源だった。あれから約4か月、状況は改善するどころか、G20の壇上で「クライシス」という言葉が使われるところまで来た。今回はその電源セグメントをさらに一段階解剖し、「$100の電力設備投資がどこに落ちるか」というバリューチェーンの絵を描き直したい。
率直に言うと、この見出しの一文を読んだとき、私は半分驚いて半分納得した。
マスクがG20で語った内容を整理すると、骨格はシンプルだ。AIチップの生産能力は年40〜50%というペースで増えているのに対し、中国を除いた発電容量の伸びは年10〜20%にとどまる。この非対称性が積み上がった結果として、2027年には15GW以上の電力が不足するというコンセンサス推計が示された。マスク自身の言葉を借りれば「AIの電力危機はすでに起きている、遠い先の話ではない」。
| 指標 | 数値 | 出典 |
|---|
| AIチップ生産の年間成長率 | 40〜50% | Musk、G20発言(2026年9月1日) |
| 非中国圏の発電容量成長率 | 10〜20% | 同上 |
| 2027年の電力不足見込み | 15GW以上 | 同上、業界コンセンサス推計 |
| 世界のデータセンター電力消費 | 2025年485TWh → 2030年950TWh(2026年更新見通し) | IEA:Key Questions on Energy and AI |
ここで一つ、訂正しておきたいことがある。この発言をめぐって「フィジカルAIはデジタルAIの10倍になりうる」という数字が独り歩きし、一部ではNVIDIAのジェンスン・フアンの発言として紹介されているのを見かけた。私が実際に確認できた範囲では、この「10倍」という数字はマスク自身の発言であり、フアンの発言としての裏は取れなかった。フアンは同じG20に登壇していたが、私が確認できた彼の発言は「すべての国が自国経済を支えるインフラを構築する必要がある」、そして「1GWのAIインフラを構築するコストはおおよそ500〜600億ドル」という、インフラ投資の規模感を示すものだった。近い文脈の発言ではあるが、別人の発言を別人に帰属させるのは、この手のテーマではよくある事故だと思う。数字を扱う記事を書く以上、ここは丁寧にやりたい。
マスクはさらに、デジタルAI単独で世界経済を20〜30%(年20〜30兆ドル)押し上げ、フィジカル層(ヒューマノイドロボットなど)が加われば効果は10倍規模になりうると述べている。保守的に見て10億台超のヒューマノイドが、1台あたり人間の約5倍の生産性を発揮するという試算も添えられていた。この数字の当否は本稿の射程外に置く。私が扱いたいのは、その手前にある、もっと地味で、もっと投資しやすい問題——電力供給という物理制約のほうだ。
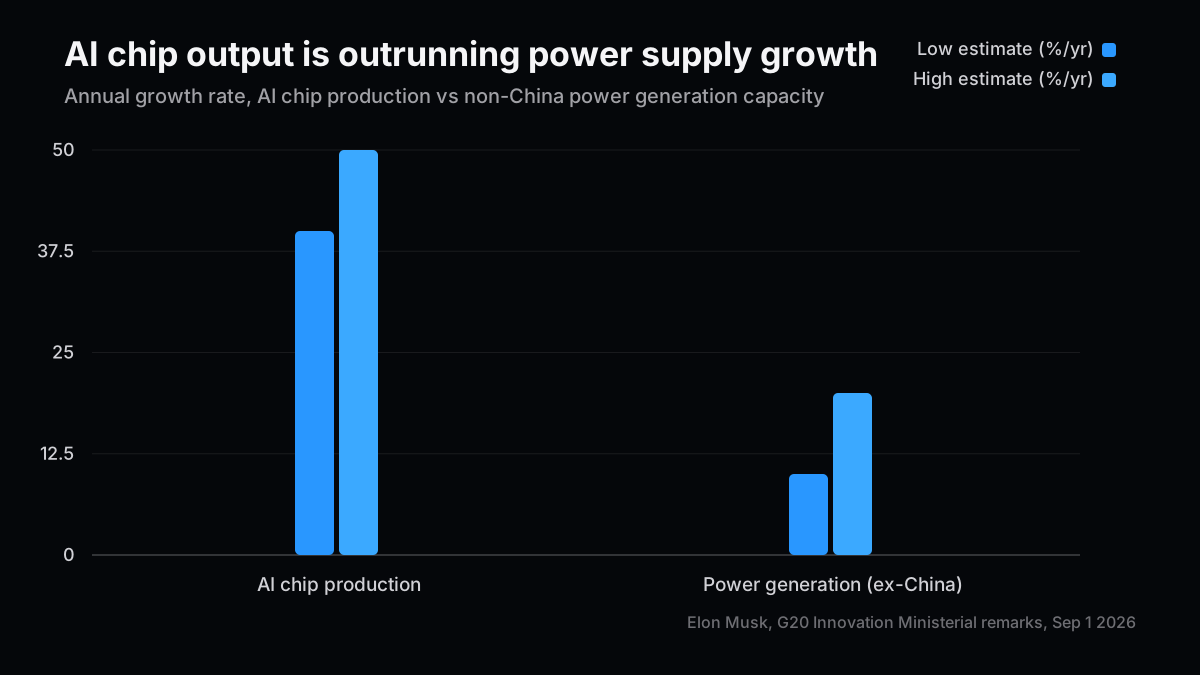
チップの生産曲線と発電の曲線を並べて見ると、ギャップは年を追うごとに拡大する形になる。半導体プロセスの現場にいた人間として言えば、需要曲線がこれだけ急な指数関数で、供給曲線がほぼ線形にしか伸びないとき、ボトルネックは需要側の減速でしか解消しない。増産で追いつく話ではない。
ここからは、電力危機という抽象的な言葉を、実際に投資の意思決定に使える解像度まで落とし込む。
新しいデータセンターを建てるとき、最初にぶつかる壁が系統連系である。米国最大級のPJM管内では、AI関連の大型案件が実際に稼働するまで平均7年超かかっている。内訳は、連系合意(Interconnection Service Agreement)を得るまでに3年超、そこから実際にエネルギー化するまでにさらに4年超。業界推計ではCAISOで5〜6年、MISOで約5年とされ、全米の中央値もLBNL(ローレンス・バークレー国立研究所)の集計で5年を超えている。
より厳しいのは、2000〜2020年に系統連系を申請した案件のうち、2025年末までに商業運転にこぎつけたのはわずか13%だったという事実だ。75%は取り下げられ、10%がまだ申請中のまま列に並んでいる。テキサス州ERCOTでは、大口負荷(データセンターを含む)の連系待ち行列が2024年末の63GWから2025年11月には226GWへと、1年足らずでほぼ4倍に膨らんだ。そのうち約77%がデータセンター案件だという。
| 系統・地域 | 待ち時間・規模 | 出典 |
|---|
| PJM(AI大型案件) | 平均7年超(連系合意3年超+着工後4年超) | Data Center Knowledge |
| CAISO | 5〜6年(業界推計) | 業界推計 |
| MISO | 約5年(業界推計) | 業界推計 |
| 全米中央値(2025年運開分) | 5年超、2000〜2020年申請分の商業運転到達率は13% | LBNL Queued Up 2026 |
| ERCOT大口負荷キュー | 63GW(2024年末)→ 226GW(2025年11月)、約77%がデータセンター | Latitude Media |
数字を見ながら思ったのは、これはもう「順番待ち」という言葉が生ぬるいということだ。7年という時間軸は、GPU2〜3世代分に相当する。連系待ちの列に並んでいる間に、案件を計画したときのチップ前提そのものが陳腐化してしまう。
系統連系の列を抜けても、次に待っているのが変圧器だ。2026年時点で標準的な変圧器のリードタイムは約128週、発電機昇圧用変圧器(GSU)は約144週まで伸びている。特殊仕様の大型品では最大4年という見積もりも出ている。ある送配電関係者の言葉を借りれば、変電所は「テントの中でいちばん長いポール」であり、建屋そのものは数か月で建つのに、それに電力を通す変電設備だけが物理的に間に合わない。
この供給制約の正体は、鋼材でも資本でもなく、人だ。米国内で変圧器の銅コイルを巻ける熟練工は約1.5万人しかおらず、業界の需要を満たすにはこの人数をおよそ3倍にする必要があるという分析がある。コイル巻きは職人技に近い作業で、数週間の研修では育たない。2019年比で見ると、変圧器価格は約77%、GSUは約45%、方向性電磁鋼板(GOES)は約100%、銅は約50%それぞれ上昇している。
この2つの関門——系統連系と変圧器——が、AIチップの生産ペースとはまったく別の時間軸で動いている。ここに、$100の電力設備投資がどう配分されるかという次の問いが生まれる。
#19では、AIデータセンターの「シリコン周辺」を電源・冷却・光インターコネクト・サイトの4セグメントに分解し、L2(周辺シリコン)とL3(物理レイヤー)をオーバーウェイトすべきだという結論を書いた。今回は、その結論の射程を電力そのものに延長し、$100のAI関連電力設備投資が実際にどのレイヤーへ落ちるのかを、私自身の整理として組み立て直す。
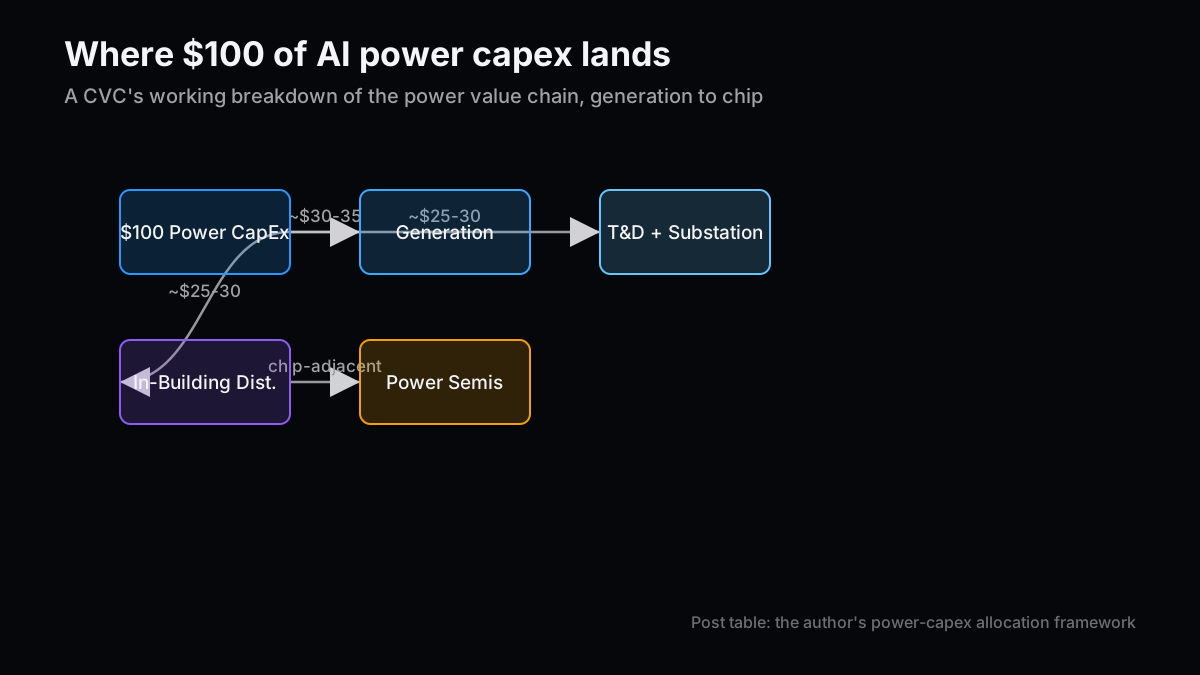
厳密な単一の出典があるわけではない——複数の一次資料を突き合わせた、私自身の試算だと理解してほしい。データセンターの建設コストのうち、変電・スイッチギア・発電機・UPS・配電を含む電力インフラ部分は全体の40〜45%を占めるという業界データがある。空冷Tier IIIの施設は1MWあたり800万〜1,400万ドル、液冷(Direct-to-Chip)は1,700万〜2,500万ドルという水準まで来ている。これらを踏まえて私が置いている配分感覚は、発電(ガスタービン・SMR等)に$30〜35、送電・変電(変圧器・スイッチギアを含む)に$25〜30、構内配電(ラック内の降圧・800V DC化を含む)に$25〜30、というものだ。
構内配電の内側で起きているのが、ワイドバンドギャップ半導体への置き換えだ。データセンター向けパワー半導体市場は2025年の約20億ドルから2032年には約43億ドルへ、年率11%で拡大する見通しで、その中でもSiC・GaNを含むワイドバンドギャップ区分は年率25%超という、市場全体より頭一つ抜けた成長率で伸びている。SiCは高電圧・高温領域(UPSや電源分配)で、GaNは高周波のサーバー電源で採用が進んでいる。効果は数字にはっきり出ていて、先端パワー半導体を組み合わせることで、電力分配ネットワークの損失を約17%から約9%までほぼ半減できるという試算もある。
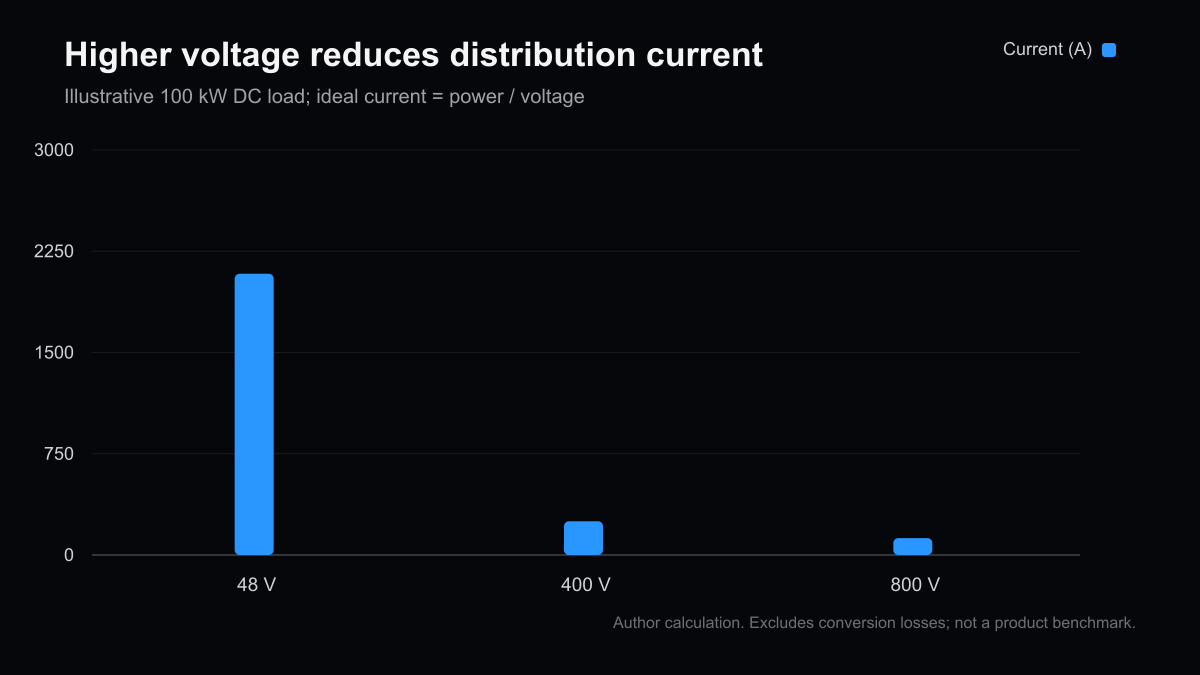
もう一つの構造変化が、NVIDIAが主導する800V DC化だ。従来の415V AC配電に比べて、同じ導体サイズで伝送できる電力が約85%増え、銅の使用量は約45%減る。1GW級のデータセンターを旧方式の配電で作ろうとすると銅だけで最大20万kgを要するという試算もあり、この銅需要そのものが変圧器と同じ供給制約に直面している。効率改善は最大5%、保守コストは最大70%減、総所有コストは最大30%減という数字が示されているが、本格的な量産はNVIDIAのKyberラックと足並みを揃えて2027年になる見込みだ。ここは、私が半年前に見立てていたタイミングより多少早まっている。
| レイヤー | 代表銘柄(公開株) | 私の現在のスタンス |
|---|
| 発電・タービン | GE Vernova(GEV)、Vistra(VST)、Constellation(CEG) | ニュートラル→オーバーウェイトへシフト中 |
| 送電・変電機器 | Hitachi Energy、ABB(ABBN)、Eaton(ETN) | オーバーウェイト |
| 構内配電・UPS | Vertiv(VRT)、Schneider Electric(SU) | オーバーウェイト |
| パワー半導体(SiC/GaN) | Infineon(IFX)、onsemi(ON)、Monolithic Power(MPWR)、Navitas(NVTS) | オーバーウェイト(選別的) |
私が前職のCVCで北米のEVリユース定置型蓄電スタートアップへの出資を実行したとき、検討の過程でいちばん時間を使ったのは電池セルの劣化曲線でも化学系の評価でもなかった。系統連系のタイミングと契約構造——ビハインド・ザ・メーター(自家消費で系統を経由しない設置)にするか、グリッド・タイド(系統連系)で正式な接続契約を結ぶか——という一点だった。後者を選ぶと、案件の経済性は電池の性能ではなく、地域の系統連系待ち行列のどこに並んでいるかで決まってしまう。当時はピークシェービング用途での評価だったが、この経験があったからこそ、今回の系統連系データを見たときに「これはまた同じ構造だ」とすぐに反応できた。電力インフラ投資は、技術の優劣より先に、順番待ちの列のどこにいるかで収益性が決まる領域なのだと思う。
#49では、ハイパースケーラー4社の増分負債調達比率がFY24の9%から2026年LTMで32%まで上がったと書いた。あの記事の文脈は金利だったが、今回の電力設備投資というテーマは、同じ資本構成の上にもう一段の支出項目が乗る形になる。系統連系・変圧器・構内配電への投資は、多くの場合ハイパースケーラーではなく電力会社やデータセンターのオペレーター側が担うが、資金の出し手をたどれば同じ信用市場に行き着く。金利が上がれば、AI設備投資と電力インフラ投資の両方が同時に細くなるリスクがある。ここは#49の見立てと地続きだと考えている。
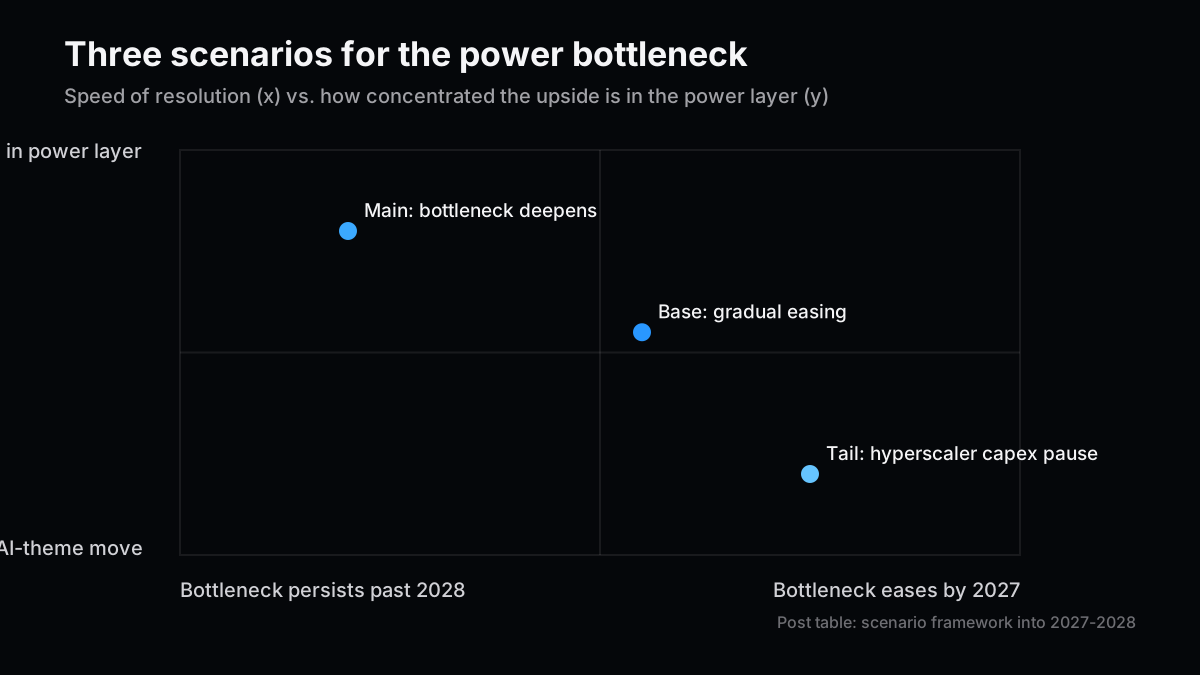
シナリオを3つに整理する。
| シナリオ | 確率(私の主観) | 内容 | 電力レイヤーへの含意 |
|---|
| ベース | 50% | 系統整備・変圧器増産が緩やかに進み、2028年にかけて逼迫が和らぐ | 選別的オーバーウェイトを継続 |
| メイン | 35% | ボトルネックが2027年にかけてむしろ深化し、AIテーマ内の資金シフトが加速 | 電力レイヤーが大幅アウトパフォーム |
| テール | 15% | 電力制約への苛立ちからハイパースケーラーがCapEx執行そのものを遅延させる | 広範囲に下落、電力レイヤーも短期は連れ安 |
現時点の私のポジションは、L2〜L3(#19の言い方を借りれば周辺シリコンと物理レイヤー)に相当する送電・変電機器と構内配電・UPSを中核に据え、パワー半導体は銘柄を絞ってオーバーウェイトする、というものだ。発電側は電力会社の規制動向次第で振れが大きいため、いまはニュートラルからオーバーウェイトへ徐々にシフトさせている途中というのが正直なところだ。
この見立てが崩れる条件も書いておく。FERCの連系規則改革が本格的に効いてきて、PJMの新規AI案件が3年以内にエネルギー化に到達するようになれば、系統連系という関門そのものの重みが軽くなり、電力レイヤーへの資金シフトという前提が緩む。そのときは電力インフラ関連銘柄への配分を減らし、むしろチップそのものやモデル層への回帰を検討する側に回る。
半導体プロセスの現場で装置起因とされていた歩留まり不良の真因を突き止めた経験から言えるのは、目立つところ(GPU、モデル、ベンチマーク)の裏には必ず地味な律速点があるということだ。今のAI投資は、その律速点が演算からついに電力へ移った局面にあるように見える。
次号の記事案
- 案1:パワー半導体銘柄をSiC/GaN比率で並べ替える — Infineon・onsemi・Monolithic Power・Navitasなど、データセンター向け売上構成とSiC/GaN比率を財務データで比較し、バリュエーションとの整合性を検証する。
- 案2:ビハインド・ザ・メーターとSMRの経済性を検証する — 系統連系待ちを回避する自家発電・SMR併設型データセンターが、実際に何年・何ドルで系統接続より優位に立つのかを試算する。
- 案3:FERC連系規則改革の進捗を採点する — 本稿の「見立てが崩れる条件」に挙げたFERC改革の実装状況を追跡し、PJMの新規案件がどこまで短縮されているかを検証する。
2026年9月12日更新:IEAの電力消費行を新しい見通しに更新し、800V配電の続編を追加した。
本文の事実関係と数値前提は、読者が確認できる一次情報・公的資料を優先して掲載している。
本記事は情報提供を目的としたものであり、特定の銘柄・サービス・契約条件の推奨や投資助言ではありません。執筆者は記事内で言及した銘柄にポジションまたは利害関係を持つ可能性があります。調査、翻訳、校正の一部に生成AIを利用しています。2026年9月12日の追記・修正は自動処理によるものです。詳細は免責事項をご確認ください。
Power, Not Compute: Mapping the AI Electricity Bottleneck Across Power Semiconductors and the Grid
I will admit I almost skipped the G20 Innovation Ministerial in Chapel Hill on September 1, 2026. Then Elon Musk's remarks, delivered virtually, started circulating, and one line made me stop scrolling: there "actually is quite a crisis of power" for AI, and it is not a distant problem -- it is already here. My first association was not chips or model benchmarks. It was a deal from my prior CVC job where an interconnection timeline nearly killed an investment thesis that had nothing wrong with its underlying technology.
In the August 28–September 24, 2026 Search Console window, this page received 3 clicks from 158 impressions (about 1.9% by calculation). Inrush, short-circuit isolation, and branch selectivity sit beyond the conversion map; the 800 V rack protection case study separates those layers using TI published test conditions.
Power is an unglamorous theme. It does not generate the same headlines as a new GPU generation or a benchmark leaderboard. But when I mapped AI infrastructure's "silicon periphery" in Part 19 of this series, power was the one segment I flagged as furthest from resolution among the four -- power, cooling, optics, and site. Four months later, the situation has not improved; it has escalated to the point where "crisis" is the word used from a G20 stage. This piece cuts one layer deeper into that power segment and redraws the map of where $100 of AI-related power capital expenditure actually lands.
Reading that line, I was half surprised and half not.
Strip Musk's G20 remarks down to their skeleton and the logic is simple. AI chip production capacity is growing roughly 40-50% a year, while power generation capacity outside China is growing only 10-20% a year. Compound that gap and you get the number he cited: a consensus estimate of at least a 15-gigawatt power shortfall for AI by 2027. In his words, the power crisis for AI "is already here, it is not a far-off thing."
| Metric | Figure | Source |
|---|
| AI chip production, annual growth | 40-50% | Musk, G20 remarks (Sep 1, 2026) |
| Power generation ex-China, annual growth | 10-20% | Same |
| Projected 2027 power shortfall | 15+ GW | Same, industry consensus estimate |
| Global data center electricity use | 485 TWh in 2025 to 950 TWh in 2030 (2026 updated outlook) | IEA: Key Questions on Energy and AI |
Here I want to make a correction, because I have seen it get garbled. A number from this same event -- that physical AI could be worth roughly ten times as much as digital AI -- has been circulating attributed to NVIDIA's Jensen Huang. As far as I can verify, that ten-times figure is Musk's, not Huang's. Huang did attend the same G20 event, but the quotes I could actually confirm from him were different: "every single country needs to build infrastructure so you can support your own local economy," and a concrete cost benchmark -- roughly $50-60 billion to build one gigawatt of AI infrastructure. Related territory, different speaker. Attributing one person's number to another is a common failure mode in reporting on events like this, and since this piece runs on numbers, I want to be careful about it.
Musk went on to estimate that digital AI alone could add 20-30% to the global economy, roughly $20-30 trillion a year, and that the physical layer -- humanoid robots and the like -- could push that multiple by a factor of 10 or more. He floated a conservative estimate of over a billion humanoids, each about five times as productive as a human. Whether those numbers hold up is outside the scope of this piece. What I want to focus on is the less exciting, more investable problem sitting just upstream of it: the physical constraint of electricity supply.
Lay the chip curve and the generation curve side by side and the gap widens every year rather than closing. From my time in semiconductor process work, when a demand curve is this exponential and a supply curve is close to linear, the bottleneck resolves only through demand deceleration -- not through anyone simply building faster.
From here I want to bring the abstraction down to a resolution I can actually use to make investment decisions.
The first wall any new data center hits is grid interconnection. In PJM, the largest US grid operator, AI-related large-load projects entering service average more than seven years from application to energization -- more than three years to reach an interconnection service agreement, and another four-plus years after that to actually come online. Industry estimates put CAISO at five to six years and MISO at around five. The LBNL (Lawrence Berkeley National Laboratory) national median, across all fuel types, has crossed five years for projects reaching commercial operation in 2025.
The harder number is the completion rate: of projects that requested interconnection between 2000 and 2020, only 13% had reached commercial operation by the end of 2025. Seventy-five percent were withdrawn; 10% are still sitting in the queue. In ERCOT, Texas's grid, the large-load interconnection queue -- which includes data centers -- grew from 63 GW at the end of 2024 to 226 GW by November 2025, nearly quadrupling in under a year, with roughly 77% of that load coming from data centers.
| Grid / Region | Wait time / scale | Source |
|---|
| PJM (large AI projects) | 7+ years total (3+ to ISA, 4+ more to energize) | Data Center Knowledge |
| CAISO | 5-6 years (industry estimate) | Industry estimate |
| MISO | ~5 years (industry estimate) | Industry estimate |
| National median (2025 completions) | 5+ years; only 13% of 2000-2020 requests reached operation | LBNL Queued Up 2026 |
| ERCOT large-load queue | 63 GW (end 2024) to 226 GW (Nov 2025); ~77% data centers | Latitude Media |
Sitting with these numbers, "waiting in line" feels like too gentle a phrase. Seven years spans two or three GPU generations. By the time a project clears the queue, the chip assumptions it was originally planned around are already dated.
Clear the interconnection queue and the next wait is for transformers. As of 2026, standard power transformer lead times run around 128 weeks, generator step-up units (GSUs) around 144 weeks, and specialty high-capacity units are being quoted at up to four years out. One transmission-industry source put it bluntly: the substation is "the longest pole in the tent" -- the building goes up in months, but the equipment to energize it does not.
The real constraint here is not steel or capital -- it is labor. The US transformer manufacturing workforce, the people who hand-wind copper coils, numbers around 15,000, and meeting projected demand would require roughly tripling that headcount. Coil winding is closer to a craft than an assembly-line task; it is not something you train in a matter of weeks. Since 2019, prices are up roughly 77% for power transformers, 45% for GSUs, about 100% for grain-oriented electrical steel, and about 50% for copper.
These two gates -- interconnection and transformers -- move on a completely different clock than AI chip production. Which raises the next question: given all that friction, where does $100 of power capital expenditure actually land?
In Part 19, I broke AI data center infrastructure into four peripheral segments -- power, cooling, optics, and site -- and concluded that L2 (peripheral silicon) and L3 (the physical layer) deserved an overweight. This piece extends that conclusion into the power layer itself, decomposing where $100 of AI-related power capex actually lands, as my own working framework.
To be clear, there is no single source for this exact split; what follows is my own estimate, built by cross-referencing several primary data points. Industry data puts power infrastructure -- substations, switchgear, generators, UPS systems, and distribution -- at 40-45% of a data center's hard construction cost. Air-cooled Tier III facilities run $8-14 million per critical IT megawatt in 2026; direct-to-chip liquid-cooled facilities run $17-25 million. Working from those anchors, the allocation I actually use is roughly this: $30-35 to generation (gas turbines, SMRs), $25-30 to transmission and substations (including transformers and switchgear), and $25-30 to in-building distribution (rack-level step-down, the shift to 800V DC).
Inside that in-building distribution slice is where wide-bandgap semiconductors are displacing silicon. The data center power semiconductor market is projected to grow from roughly $2.0 billion in 2025 to about $4.3 billion by 2032, an 11% CAGR overall -- but the wide-bandgap segment specifically, SiC and GaN, is growing at more than 25% a year, well ahead of the market. SiC is winning in high-voltage, high-temperature applications -- UPS systems and power distribution; GaN is scaling fastest in high-frequency server power supplies. The efficiency payoff is concrete: combining advanced wide-bandgap devices has been shown to cut power delivery network losses from roughly 17% down to about 9%.
The second structural shift is NVIDIA's push toward 800V DC distribution. Compared with legacy 415V AC, the same conductor size can carry roughly 85% more power, while copper use drops by around 45%. A 1 GW data center built on the legacy approach could require up to 200,000 kg of copper -- and that copper demand runs into the same supply constraints as transformers. The claimed benefits are up to 5% better end-to-end efficiency, up to 70% lower maintenance cost, and up to 30% lower total cost of ownership, but full-scale volume production is timed to arrive alongside NVIDIA's Kyber racks in 2027 -- somewhat sooner than I had it penciled in six months ago.
| Layer | Listed anchors | My current stance |
|---|
| Generation / turbines | GE Vernova (GEV), Vistra (VST), Constellation (CEG) | Neutral, shifting toward overweight |
| Transmission / substation equipment | Hitachi Energy, ABB (ABBN), Eaton (ETN) | Overweight |
| In-building distribution / UPS | Vertiv (VRT), Schneider Electric (SU) | Overweight |
| Power semiconductors (SiC/GaN) | Infineon (IFX), onsemi (ON), Monolithic Power (MPWR), Navitas (NVTS) | Overweight, selective |
When I led an investment into a North American second-life EV battery stationary-storage startup at my previous CVC job, the part of the review that consumed the most time was not the cell degradation curve or the chemistry review. It was interconnection timing and contract structure -- specifically, whether the system would sit behind the meter (self-consumption, no grid connection required) or be grid-tied through a formal interconnection agreement. Choose the latter, and the project's economics stop being about battery performance and start being about where in the regional interconnection queue you happen to land. That deal was originally framed around peak shaving, but the lesson stuck: in power infrastructure, profitability is set less by whose technology is better and more by where you sit in the queue. Seeing this same structure show up in today's interconnection data was, frankly, not a surprise.
In Part 49, I wrote that the ratio of incremental debt financing to capital expenditure across the four hyperscalers rose from 9% in FY24 to 32% on a 2026 trailing-twelve-month basis. That piece was framed around interest rates, but power capex adds a second layer of spending onto the same capital structure. Interconnection, transformers, and in-building distribution are usually funded by utilities and data center operators rather than the hyperscalers directly, but trace the money back far enough and it runs through the same credit markets. If rates rise, both AI capex and power infrastructure capex can tighten at once. That is the same fragility Part 49 flagged, just wearing a different hat.
Three scenarios, laid out.
| Scenario | Subjective probability | Content | Implication for the power layer |
|---|
| Base | 50% | Grid buildout and transformer supply improve gradually; pressure eases through 2028 | Maintain selective overweight |
| Main | 35% | The bottleneck actually deepens through 2027; capital rotates harder into the power layer within the AI theme | Sharp outperformance for the power layer |
| Tail | 15% | Hyperscalers pause capex execution out of frustration with power constraints | Broad decline, power names caught in the downdraft short term |
My current position is to hold transmission/substation equipment and in-building distribution/UPS -- what Part 19 called L2 and L3 -- as the core overweight, with power semiconductors held selectively overweight by name. Generation is more exposed to utility regulatory swings, so I am running that at neutral, shifting gradually toward overweight rather than committing outright.
Let me also state what would change my mind. If FERC's interconnection rule reforms actually bite and new AI projects in PJM start reaching energization within three years, the weight of the interconnection gate itself lightens, and the premise behind this whole capital rotation into the power layer weakens. At that point I would trim power infrastructure exposure and look back toward chips and the model layer instead.
From my time tracing a yield problem that had been blamed on equipment back to its real process-level root cause, one lesson stuck: behind whatever is visible and glamorous -- the GPU, the model, the benchmark -- there is almost always a duller rate-limiting step underneath. Right now, AI investing looks like it has finally arrived at the point where that rate-limiting step has moved from compute to power.
Next Issue Ideas
- Idea 1: Ranking power-semiconductor names by SiC/GaN mix — Compare Infineon, onsemi, Monolithic Power, and Navitas on data-center revenue exposure and wide-bandgap mix against current valuations.
- Idea 2: Pricing behind-the-meter and SMR economics — Model how many years and dollars a self-generation or SMR-co-located data center actually saves versus waiting in the interconnection queue.
- Idea 3: Scoring FERC interconnection reform — Track implementation of the FERC reforms flagged as this piece's what-would-change-my-mind trigger, and check how much PJM timelines have actually compressed.
Updated September 12, 2026: replaced the IEA electricity-consumption row with its updated outlook and added the 800V follow-up.
The factual and numerical assumptions in this article prioritize primary and official sources readers can verify themselves.
This article is provided for informational purposes only and is not a recommendation or investment advice regarding any specific security, service, or contract terms. The author may hold positions or have interests in the names discussed. Generative AI was used for parts of the research, translation, and proofreading. The additions and corrections dated September 12, 2026 were automated. Please see the disclaimer for details.