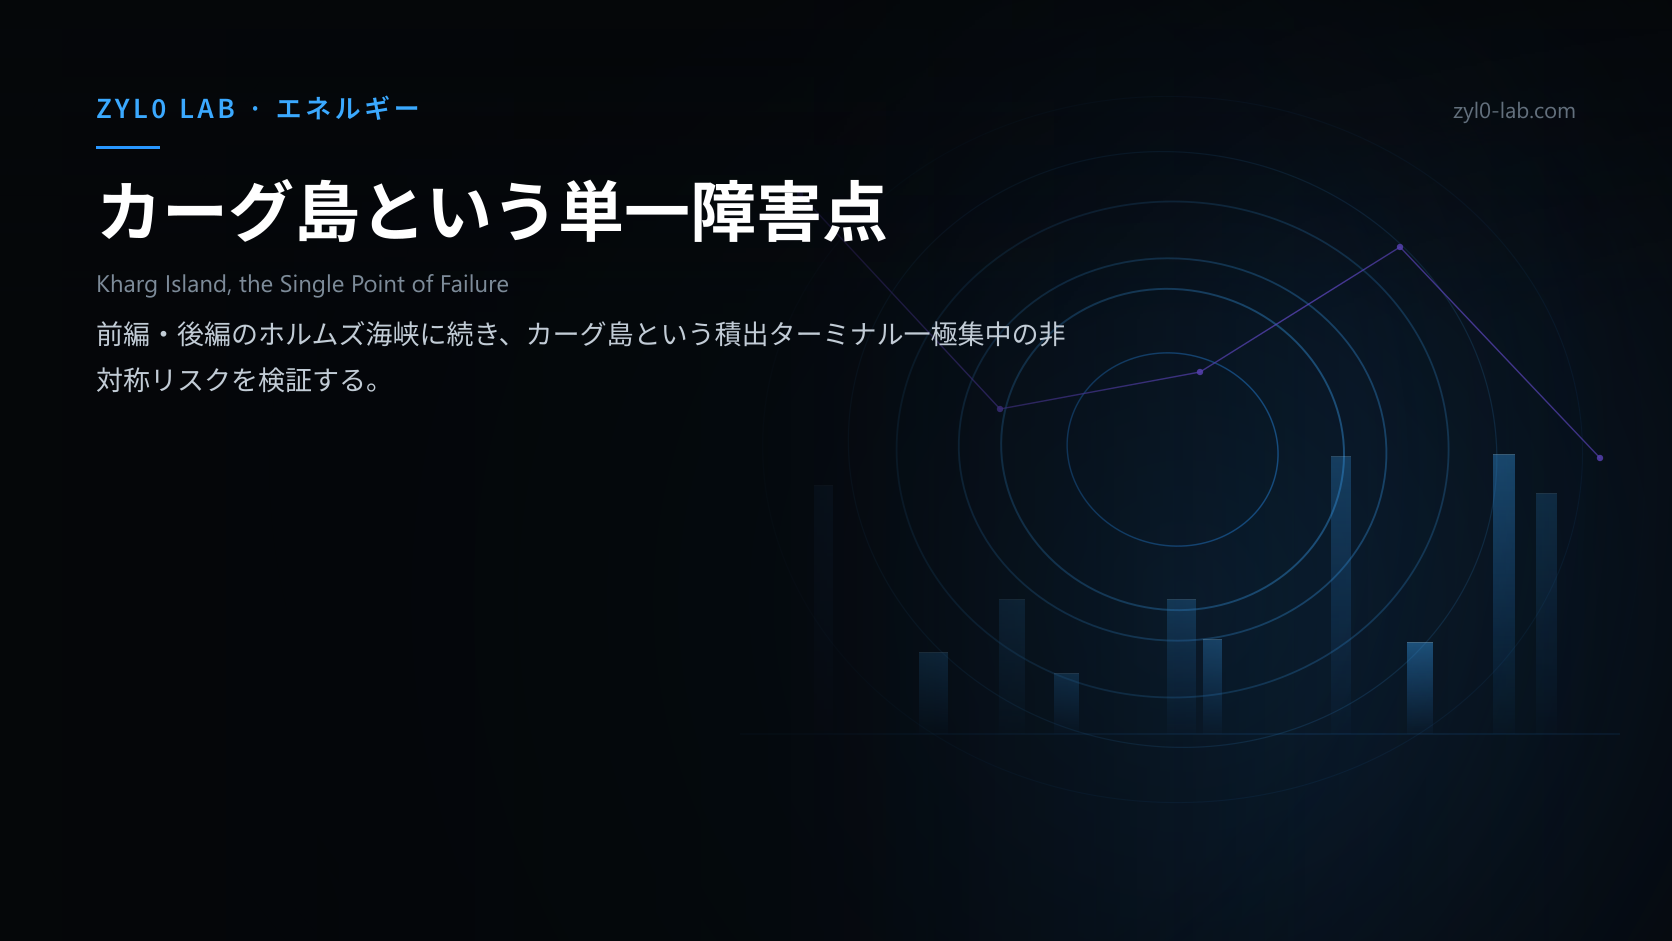
イラン戦争、半年後の原油覇権図[前編]航路と備蓄はどこへ動いたか
3月末に石炭株の記事を書いたとき、「次号は本記事の前提を最新データで更新し、何が強まり、何が崩れたかを再点検する」と自分で予告していました。あれから5か月。正直に言うと、書きながら「ここまで長引くとは思っていなかった」というのが最初の実感です。今回は石炭ではなく、その手前にある輸送経路と備蓄という2つの一次データに絞って、何が実際に起きたのかを棚卸しします。
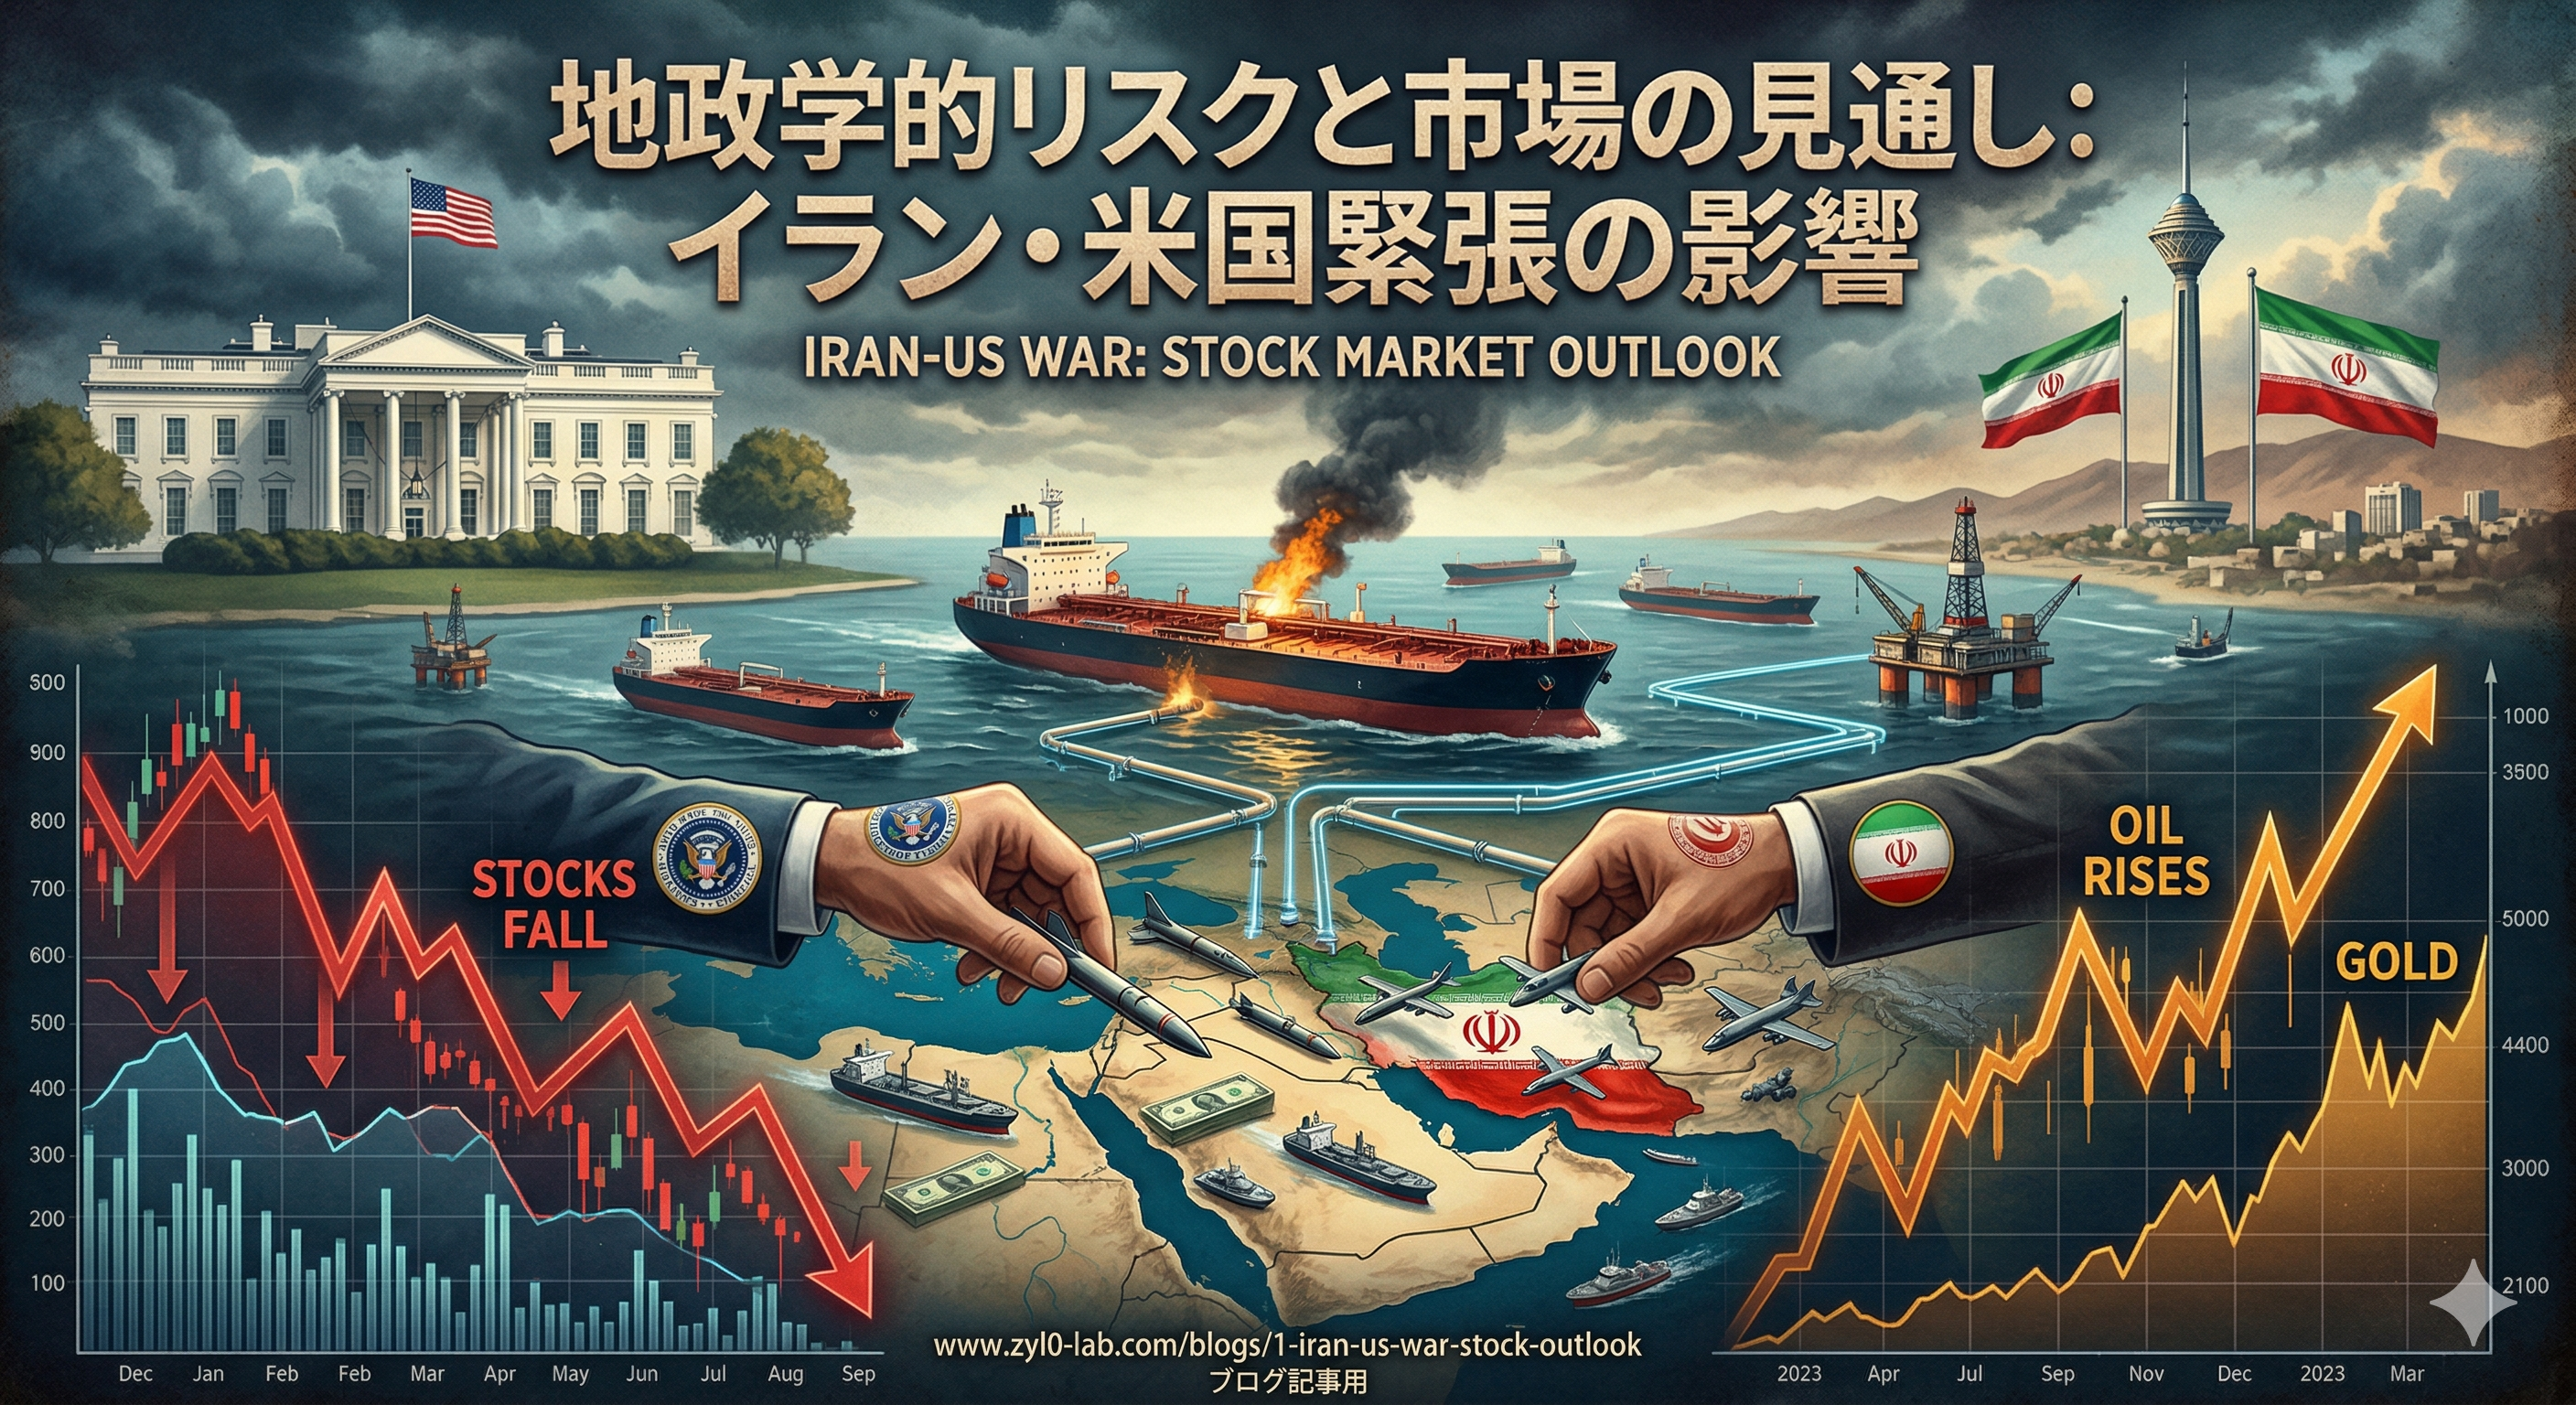
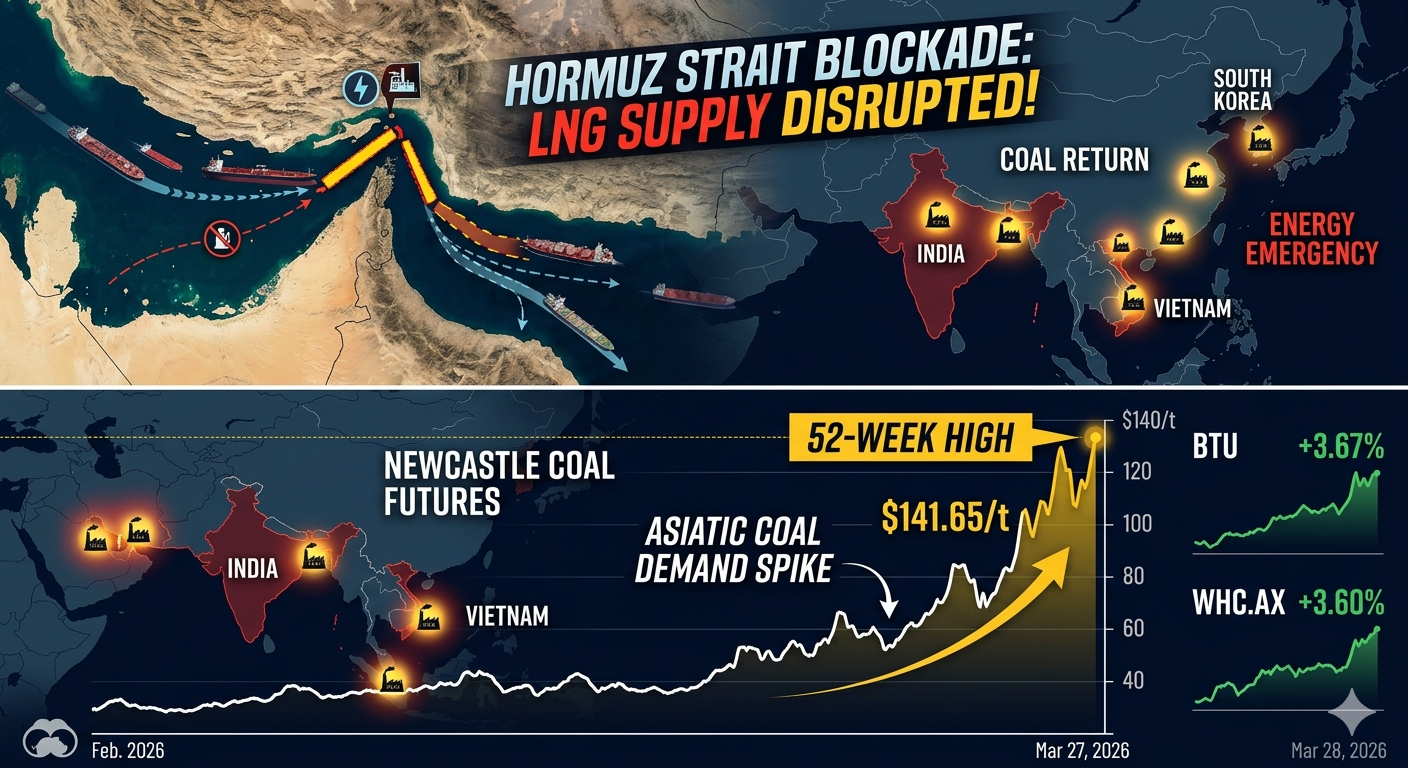
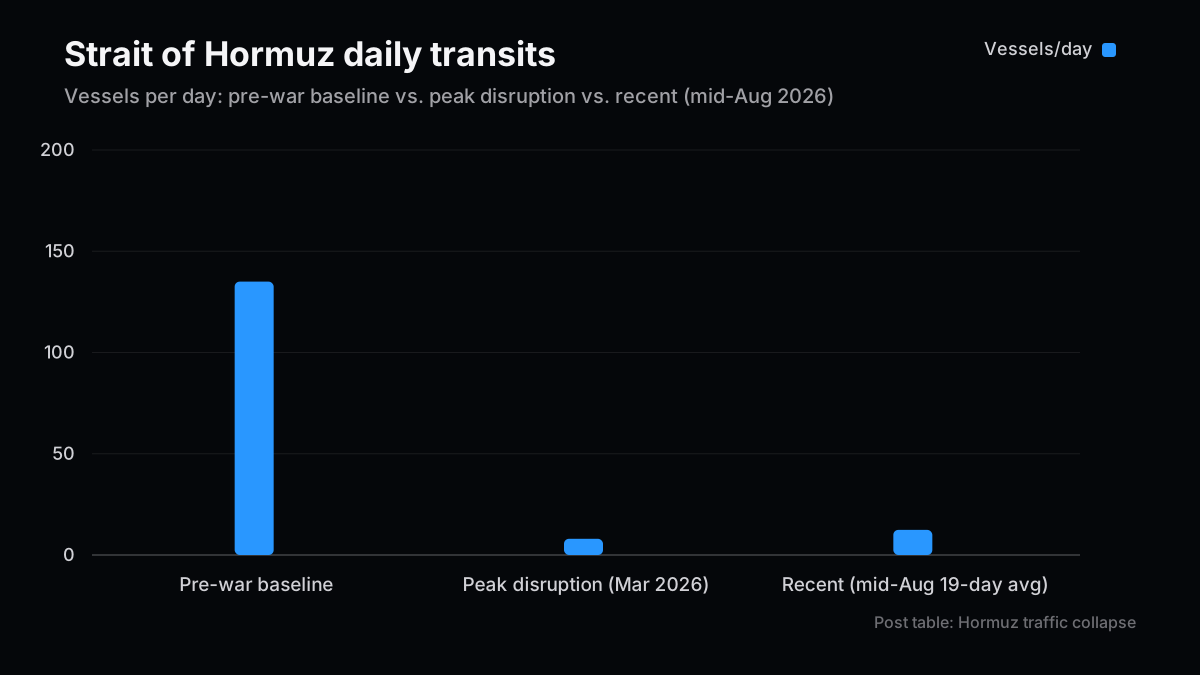
まず、いちばん驚いた数字から置きます。開戦前のホルムズ海峡は1日あたり130〜140隻が通過する、世界で最も混雑した海上チョークポイントのひとつでした。それが3月2日の封鎖開始直後には、一時2日間でわずか16隻という記録的な落ち込みを記録しています。
半年経った今はどうか。直近の観測(8月中旬の19日間)では通航実績が236隻、1日平均でおよそ12隻にとどまっています。平時比で9割減という水準が、実は半年間ほぼ変わっていません。しかも通航している船舶のうち80%超は、イランが強く反発しているオマーン主導の国連承認ルート経由——つまり「海峡は開いている」というより「イランの主張する管轄を迂回する形で、細い一本道だけが機能している」という方が実態に近いです。
3月28日の前回記事で残した最大の宿題は「4月6日のデッドライン」でした。ここは経緯が入り組んでいるので、時系列で整理します。
| 日付 | 出来事 |
|---|
| 4/5〜4/6 | トランプ大統領がイランに48時間の最終通告、「1日でイランを壊滅させられる」と発電所・橋梁への攻撃を示唆 |
| 4/6〜4/7 | イランは圧力下での交渉を拒否しつつ、停戦・安全通航・制裁解除・復興を含む10項目の対案を提示 |
| 4/8頃 | イランがホルムズ再開に合意、トランプ大統領は2週間の停戦を発表 |
| 4月中旬 | 停戦は長続きせず、イスラマバード協議の決裂を受けて米が海上封鎖を再開 |
| 6月 | 米・イラン間でMOU(覚書)に署名 |
| 7月 | イランが「不順守」と見なした商船への攻撃で紛争再燃 |
| 8月上旬 | 米が海上封鎖を再び発動 |
| 8/25 | 米がイランに航空・海運・技術・金・デジタル資産を対象とする新たな経済制裁 |
| 8/26 | イラン・オマーン間で機雷除去を含む「暫定航路」創設の枠組み交渉が進展 |
結局、この半年は「停戦→破綻→封鎖」というサイクルを4回近く繰り返しています。4月6日は解決の始まりではなく、このサイクルの最初の1周目だった、というのが実態です。8月25日の制裁が軍事行動ではなく経済的手段にシフトしたことを、市場はデエスカレーションのシグナルとして好感していますが──ここは正直、私はまだ半信半疑です。イラン・オマーンの暫定航路構想も「機雷除去」という言葉が入っている時点で、まだ海峡には機雷が残っているという裏返しでもあります。
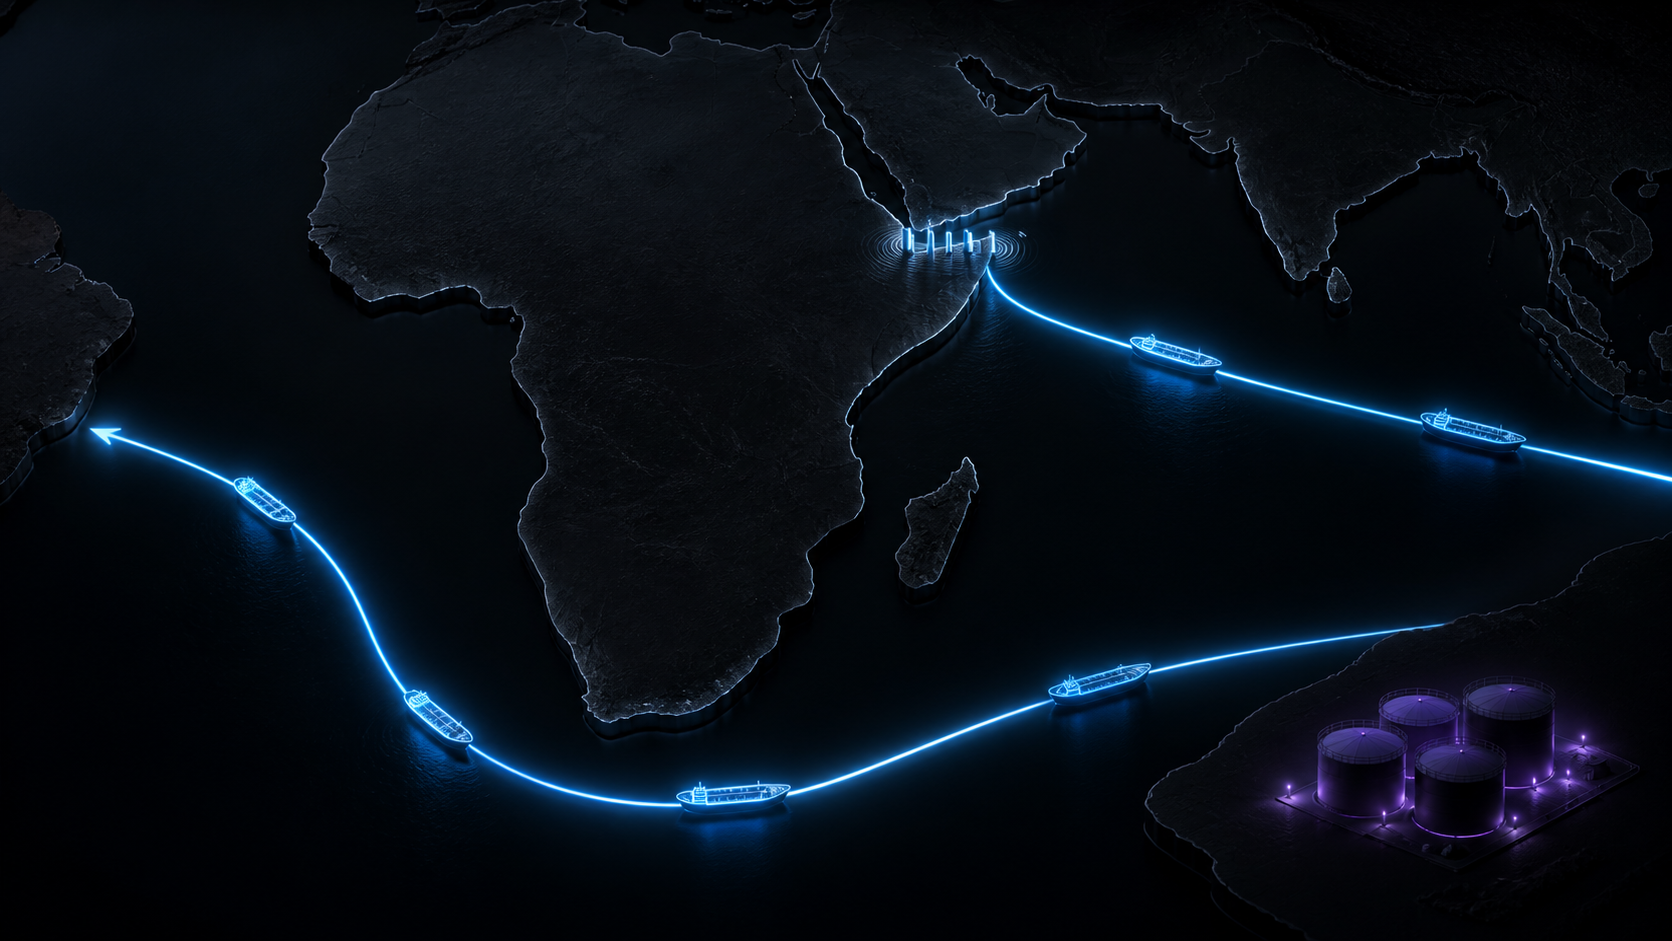
通航量が9割減った船舶は、消えたわけではありません。行き先を変えただけです。
Maersk、CMA CGM、Hapag-Lloydといった主要コンテナ船社は、中東〜欧州・米東海岸航路を喜望峰(ケープ・オブ・グッドホープ)経由に切り替えました。距離にして約3,800海里、日数にして10〜14日の追加。船隊全体では燃料・保険・傭船料の増加分が週あたり4,000万〜5,000万ドルという試算も出ています。
パイプライン代替も検討はされていますが、容量の桁が違います。UAEのADCOPパイプライン、サウジアラビアのペトロライン(東西パイプライン、紅海のヤンブー港へ接続)はいずれも実在するバイパスルートですが、ホルムズ海峡が担っていた日量1,780万バレルの一部しか吸収できません。しかも紅海ルート自体、バブ・エル・マンデブ海峡の安定に依存しているという構造上の弱点を抱えています。つまり「迂回路はある。ただし細くて、遠くて、別のチョークポイントに依存している」というのが正確な言い方だと思います。
| 輸送手段 | 追加コスト・日数 | 実際の吸収能力 |
|---|
| 喜望峰迂回(海運) | +約3,800海里、+10〜14日、船隊全体で週$40〜50M増 | ほぼ無制限(時間とコストと引き換えに) |
| UAE:ADCOPパイプライン | パイプライン利用料のみ | ホルムズ通過量のごく一部 |
| サウジ:ペトロライン→ヤンブー港 | パイプライン利用料のみ、紅海リスクあり | 同上、バブ・エル・マンデブ依存 |
私はAWSでIoT Core・Lambda・DynamoDBを組んで河川洪水検知システムをゼロから作った経験があるのですが、あのとき痛感したのは「迂回路を用意すること」と「迂回路が機能すること」はまったく別の問題だということでした。センサーを増設しても、通信経路が同じ基地局に依存していれば意味がない。ホルムズとバブ・エル・マンデブの関係も、構造としてはそれに近いと感じています。
輸送が詰まった分、価格の急騰を抑えたのは備蓄の取り崩しでした。
3月11日、IEA加盟国は史上最大となる4億バレルの戦略備蓄放出に合意しました。2022年のロシア・ウクライナ危機時の1.82億バレルを大きく上回る規模です。翌3月12日には米国が自国のSPR(戦略石油備蓄)から1.72億バレルを120日かけて放出すると表明。単純計算で7月中旬には放出が完了している計算になり、実際、直近の統計を見る限りこのペースはほぼ計画通りに進んだとみられます。
IEA加盟国が保有する緊急備蓄は、政府保有分だけで約12.5億バレル、政府義務に紐づく民間在庫を含めると約18.5億バレル規模です。4億バレルという放出規模は、この全体のおよそ2%強に相当します。「史上最大」という見出しの割に、母数で見ると意外に小さい――ここは書いていて自分でも少し驚いた点です。
| 主体 | 放出規模 | 合意・発表時期 | 完了目安 |
|---|
| IEA加盟国全体 | 4億バレル(史上最大、2022年比+120%) | 2026年3月11日 | 加盟国ごとに順次実施 |
| 米国SPR単独 | 1.72億バレル | 2026年3月12日 | 2026年7月中旬(120日後) |
| IEA緊急備蓄の母数 | 政府保有約12.5億バレル+産業在庫約6億バレル | — | — |
備蓄放出はあくまで時間を買う手段であって、需給そのものを直さないという点は繰り返し強調しておきたいです。ゴールドマン・サックスの推計では、湾岸産油国の輸出量は開戦前水準のおよそ3分の2(日量1,500万〜1,600万バレル)まで回復しているとされていますが、これは「輸送が正常化した」のではなく「別ルートで穴を埋めている」に近い状態です。備蓄はいずれ積み直さなければならず、この「積み直し」がどの銘柄にとってのトレードになるかは、後編で具体的に扱います。
2月14日の前回記事で、私は「中東向けタンカー運賃指数(BDTI)が3週間で20%以上拡大したら、株式市場より一足早いシグナルとして見ておく価値がある」と書きました。これは自分にとって半年越しの答え合わせです。
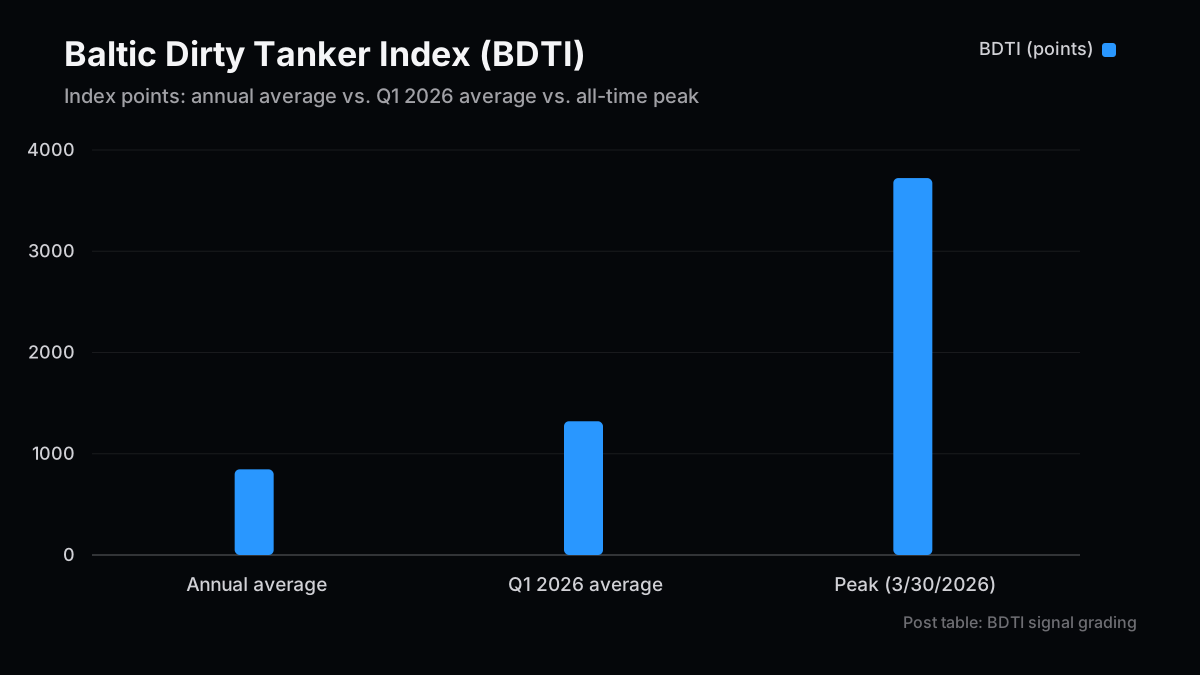
結論から言うと、当たった、というより当てが甘かったというのが正直な感想です。BDTIは3月30日に史上最高値となる3,723ポイントを記録。前年同月比で+230%という水準でした。第1四半期平均でも1,321ポイントと、通年平均846ポイントを56%上回っています。私が想定していた「20%の拡大」は、開戦後3週間ほどでとうに通過点になっていました。
湾岸〜中国のVLCC(超大型原油タンカー)のスポット運賃は、ピーク時に1日あたり20万ドルに達しています。中東湾岸〜中国(TD3Cルート)、中東湾岸〜シンガポール(TD2ルート)ともに、52週平均の10万ドル/日を大きく上回る水準を維持していました。タンカー運航会社のFrontline(FRO)は52週高値を更新しています。
| 指標 | 開戦前水準 | ピーク時 | 評価 |
|---|
| BDTI(バルチック・ダーティタンカー指数) | 通年平均846pt | 3,723pt(3/30、史上最高値、前年比+230%) | 前回記事の閾値(+20%/3週)を大幅に超過 |
| VLCC湾岸〜中国スポット運賃 | 52週平均$100k/日前後 | 約$200,000/日 | 先行指標として機能 |
| Frontline(FRO)株価 | — | 52週高値更新 | 運賃連動が株価に反映 |
この結果を見て思うのは、「先行指標を見つけたこと」より「その指標がどれだけ動くかを見誤ったこと」の方が投資家として反省点だということです。次に似た局面が来たときは、20%という閾値そのものを疑ってかかろうと思っています。
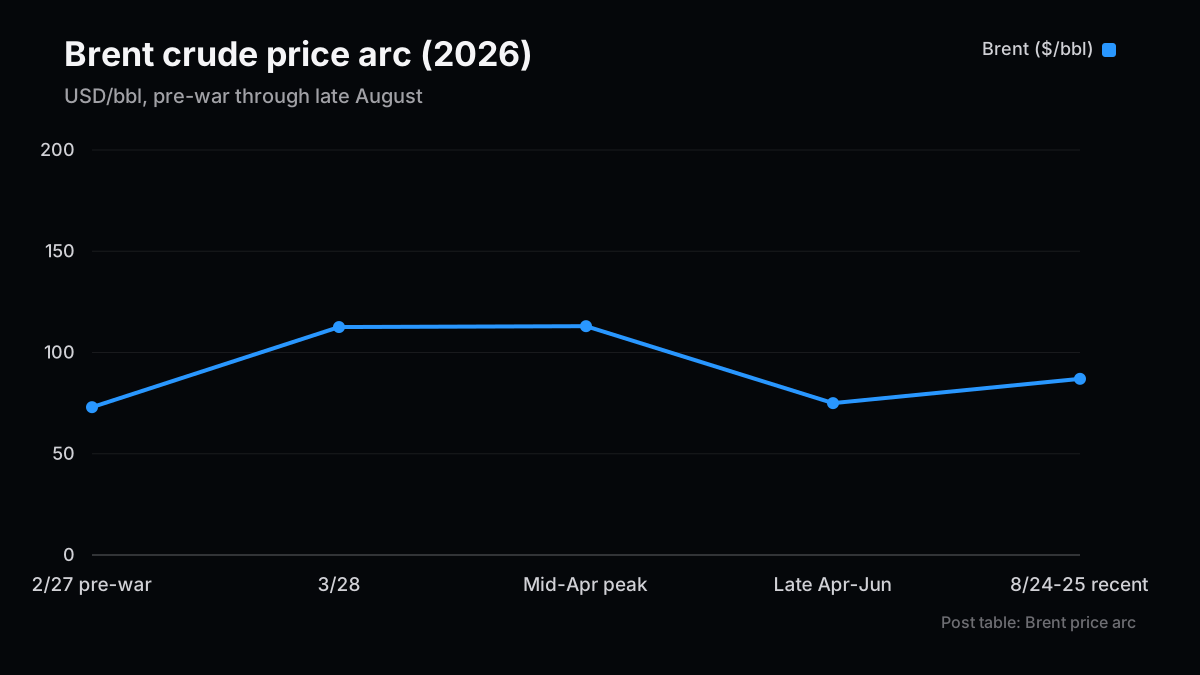
最後に、価格の現在地を確認します。ブレント原油は開戦前の$73(2月27日)から、3月28日には$112.57まで急騰したことは前回記事で書いた通りです。その後、数週間は$112〜115程度でピークを迎え、4月の停戦期待で一時$70〜80台まで値を戻しました。直近(8月24〜25日)の水準は$86〜88。開戦前を上回るものの、ピーク時からは25%前後の調整が入っています。
| 時期 | ブレント原油 | 背景 |
|---|
| 2/27(開戦前) | $73/bbl | — |
| 3/28 | $112.57/bbl | ホルムズ封鎖・カタールLNG施設被弾 |
| 4月中旬 | $112〜115/bbl前後 | 数週間のピーク圏 |
| 4月下旬〜6月 | $70〜80/bbl | 停戦・交渉期待 |
| 8/24-25(直近) | $86〜88/bbl | 8/25の経済制裁を「デエスカレーション」と好感 |
この半年を俯瞰すると、輸送と備蓄はどちらも「壊れて、応急処置され、また揺れる」を繰り返してきました。今後をどう見るかは、ベース・メイン・テールの3シナリオで整理しておきます。
| シナリオ | 内容 | ブレント想定 | 輸送・備蓄への含意 |
|---|
| ベース:段階正常化 | イラン・オマーンの暫定航路構想が具体化し、通航が徐々に回復 | $80〜90/bbl | ケープ迂回は縮小、SPR積み直し局面へ |
| メイン:サイクル継続 | 4月以降の「停戦→破綻→封鎖」が今後も繰り返す | $90〜110/bbl | 迂回・高運賃が構造的に定着 |
| テール:全面再燃 | 機雷敷設が再開、軍事的エスカレーションが再燃 | $120超 | 保険会社が容量を引き上げ、運賃$200k/日再訪 |
私自身は、直近のニュースフローだけを見ればベースケースに賭けたくなる場面ですが、この半年で「停戦の発表」が4回近く出て、そのたびに数週間で崩れてきた実績を踏まえると、メインシナリオを一番厚く見ておくのが誠実な態度だと思っています。
具体的な投資アングルについては、この記事だけでは書ききれません。タンカー株、海上戦争保険、SPR補充の受益株、LNG代替供給——これらの銘柄レベルの話は、後編でまとめて扱います。
次号の記事案
- 案2:タンカー株・海上保険・SPR補充で読む投資機会(後編) — 本記事で確認した輸送・備蓄データを踏まえ、タンカー運航会社、海上戦争保険、SPR補充受益株、LNG代替供給の具体的な銘柄とシナリオ別ポジショニングを整理する。
- 案2:石炭株の答え合わせ — 3月の石炭株記事で示した「短期ロング・中期ニュートラル」がその後どうなったか、Newcastle価格とBTU/WHCの実績で検証する。
- 案3:海上戦争保険の周期分析 — Lloyd'sのホルムズ・コンソーシアム発足から半年、保険料率の推移とサイクルの終わり方を深掘りする。
本文の事実関係と数値前提は、再審査時にも読者が確認できる一次情報・公的資料を優先して見直しています。
本記事は情報提供を目的としたものであり、特定の銘柄、サービス、契約条件の推奨や投資助言ではありません。執筆者は記事内で触れた銘柄やサービスにポジションまたは利害関係を持つ可能性があります。調査、翻訳、校正の一部に生成AIを利用していますが、最終的な内容はZYL0が確認しています。詳細は免責事項をご確認ください。
Oil's New Map, Six Months Into the Iran War — Part 1: How Routes and Stockpiles Actually Shifted
When I wrote about coal stocks at the end of March, I promised myself a follow-up: revisit the thesis with fresh numbers and separate what strengthened from what broke. Five months later, my honest first reaction while drafting this is that I didn't expect the situation to drag on this long. This time I'm setting coal aside and focusing on the two datasets that sit upstream of every other story here — transport routes and stockpiles — and taking inventory of what actually happened.
Let me start with the number that surprised me most. Before the war, the Strait of Hormuz carried roughly 130-140 vessels a day, one of the busiest maritime chokepoints on earth. Within days of the March 2 blockade, transits fell to as few as 16 vessels over a two-day span at the worst point.
Six months on, where do things stand? The most recent observation window (19 days in mid-August) recorded 236 transits — an average of roughly 12 ships per day. A roughly 90% shortfall from baseline has, remarkably, held steady for most of the past six months. And more than 80% of the liquids still transiting recently move through an Oman-led, UN-authorized corridor that Iran openly objects to — so "the strait is open" overstates it. A more accurate read is "one narrow, internationally brokered lane functions, bypassing the jurisdiction Iran claims."
The biggest unresolved item from my March 28 piece was the "April 6 deadline." The sequence that followed is tangled enough to warrant a timeline.
| Date | Event |
|---|
| Apr 5-6 | Trump issues a 48-hour final ultimatum to Iran, threatens to "decimate Iran in one night," hints at strikes on power plants and bridges |
| Apr 6-7 | Iran refuses to negotiate under pressure but offers a 10-clause counterproposal covering a ceasefire, safe-passage protocol, sanctions relief, and reconstruction |
| ~Apr 8 | Iran agrees to reopen Hormuz; Trump announces a two-week ceasefire |
| Mid-April | The ceasefire proves short-lived; the US reimposes a naval blockade after the "Islamabad Talks" collapse |
| June | The US and Iran sign an MOU |
| July | Conflict resumes as Iran strikes shipping it deems "noncompliant" |
| Early August | The US reimposes the naval blockade again |
| Aug 25 | The US imposes new sanctions on Iran targeting aviation, shipping, technology, gold, and digital assets |
| Aug 26 | Iran and Oman advance talks on a phased "temporary shipping corridor" framework, including mine clearance |
Net-net, this half-year has cycled through "ceasefire → breakdown → blockade" almost four times. April 6 wasn't the resolution — it was lap one. Markets are reading the August 25 sanctions shift toward economic rather than military tools as a de-escalation signal, and honestly, I'm still on the fence about that. The fact that the Iran-Oman corridor framework explicitly includes "mine clearance" is itself an admission that mines are still there.
The 90% of vessels that stopped transiting Hormuz didn't vanish. They just changed course.
Maersk, CMA CGM, and Hapag-Lloyd all redirected their Middle East-Europe and Middle East-US East Coast services around the Cape of Good Hope. That adds roughly 3,800 nautical miles and 10-14 days per voyage. Industry estimates put the fleet-wide added cost — fuel, insurance, higher charter rates — at $40-50 million per week.
Pipeline alternatives exist, but the capacity gap is an order of magnitude. The UAE's ADCOP pipeline and Saudi Arabia's Petroline (the East-West pipeline to the Red Sea port of Yanbu) are real bypass routes, but between them they absorb only a fraction of the 17.8 million barrels a day that used to move through Hormuz. Worse, the Red Sea leg itself depends on the Bab el-Mandeb strait staying stable — a second chokepoint sitting behind the first one. The honest summary is: detours exist, but they're narrow, slow, and dependent on a different pinch point holding.
| Route/Mode | Added cost / time | Actual absorption capacity |
|---|
| Cape of Good Hope reroute (sea) | +~3,800nm, +10-14 days, ~$40-50M/week fleet-wide | Effectively unlimited, at a cost |
| UAE: ADCOP pipeline | Pipeline tariff only | A small fraction of Hormuz volume |
| Saudi: Petroline → Yanbu | Pipeline tariff only, Red Sea risk | Same, plus Bab el-Mandeb dependency |
I built a river-flood detection system from scratch on AWS — IoT Core, Lambda, DynamoDB — and the lesson that stuck with me is that "having a detour" and "the detour actually working" are two very different problems. Adding sensors doesn't help if they all route through the same base station. The relationship between Hormuz and Bab el-Mandeb strikes me as structurally similar.
What kept prices from spiking further while shipping was jammed was the drawdown of strategic stockpiles.
On March 11, IEA member countries agreed to release 400 million barrels — the largest coordinated release in the agency's history, well above the 182 million barrels released after Russia's 2022 invasion of Ukraine. The next day, the US committed to releasing 172 million barrels from its own SPR over 120 days. Do the math and that lands around mid-July for full completion, and the most recent data suggests the pace largely tracked plan.
IEA members collectively hold about 1.25 billion barrels in government-controlled emergency reserves, plus roughly another 600 million tied to industry-obligation stocks. The 400-million-barrel release amounts to a little over 2% of that combined pool. That's a smaller share than the "largest ever" headline implies — honestly, that surprised me even while writing it.
| Actor | Release size | Agreed/announced | Completion target |
|---|
| IEA members (combined) | 400 million barrels (record, +120% vs. 2022) | March 11, 2026 | Phased by member country |
| US SPR (standalone) | 172 million barrels | March 12, 2026 | ~mid-July 2026 (120 days out) |
| IEA emergency reserve base | ~1.25B government + ~0.6B industry | — | — |
It's worth stressing that reserve releases buy time — they don't fix the underlying supply-demand imbalance. Goldman Sachs estimates Gulf crude exports have recovered to roughly two-thirds of pre-war levels (15-16 million barrels/day), but that reflects rerouting around the bottleneck, not the bottleneck clearing. Those reserves eventually have to be refilled, and which names benefit from that refill cycle is a Part 2 question, not a Part 1 one.
In my February 14 piece, I flagged that if the Middle East tanker freight index (BDTI) widened more than 20% over three weeks, it was worth treating as a leading signal ahead of equities. This is my six-month scorecard on that call.
The short version: I was directionally right, but I badly undersold the magnitude. BDTI hit an all-time high of 3,723 points on March 30 — up 230% year-over-year. Q1 2026's average of 1,321 points ran 56% above the full-year average of 846. The "20% widening" threshold I flagged wasn't a warning sign — it was already ancient history within three weeks of the war starting.
VLCC spot rates from the Gulf to China peaked around $200,000 a day. Both the Gulf-China (TD3C) and Gulf-Singapore (TD2) routes held well above their 52-week average of roughly $100,000/day. Frontline (FRO), a tanker operator, hit a 52-week high on the back of it.
| Indicator | Pre-war level | Peak | Grade |
|---|
| BDTI (Baltic Dirty Tanker Index) | Annual average 846pt | 3,723pt (3/30, all-time high, +230% YoY) | Blew through the prior +20%/3wk threshold |
| VLCC Gulf-China spot rate | ~$100k/day (52wk avg) | ~$200,000/day | Worked as a leading signal |
| Frontline (FRO) share price | — | 52-week high | Freight repricing flowed through to equity |
Looking back, my real error wasn't finding the right leading indicator — it was underestimating how far it could run. Next time a chokepoint shock like this shows up, I plan to treat any fixed percentage threshold as a floor, not a ceiling.
Last, the price picture. Brent moved from $73 pre-war (Feb 27) to $112.57 by March 28, as I covered last time. It then held around $112-115 for a few more weeks before ceasefire hopes in April pulled it back toward $70-80. The most recent print (Aug 24-25) is $86-88 — still above pre-war levels, but roughly 25% off the peak.
| Period | Brent | Context |
|---|
| 2/27 (pre-war) | $73/bbl | — |
| 3/28 | $112.57/bbl | Hormuz blockade, Qatar LNG facility struck |
| Mid-April | ~$112-115/bbl | Multi-week peak zone |
| Late April-June | $70-80/bbl | Ceasefire and negotiation optimism |
| 8/24-25 (recent) | $86-88/bbl | Aug 25 sanctions read as de-escalatory |
Stepping back over the full six months, both routes and stockpiles have followed the same pattern: break, patch, wobble again. Here's how I'd frame what comes next, across three scenarios.
| Scenario | Description | Brent | Implication for routes/stockpiles |
|---|
| Base: staged normalization | The Iran-Oman corridor framework materializes; transit volumes gradually recover | $80-90/bbl | Cape rerouting shrinks; SPR refill phase begins |
| Main: the cycle continues | The "ceasefire-breakdown-blockade" pattern seen since April repeats again | $90-110/bbl | Rerouting and elevated freight become structurally embedded |
| Tail: full re-escalation | Mining resumes at scale; military escalation returns | $120+ | Insurers pull capacity, freight retests $200k/day |
My own instinct, looking only at the latest headlines, would be to lean toward the base case. But given that we've seen roughly four "ceasefire announced" moments in six months, each unwinding within weeks, weighting the main scenario most heavily feels like the more honest call.
I can't do the ticker-level work justice in this article alone. Tanker operators, marine war-risk insurers, SPR-refill beneficiaries, and LNG alternative supply — that's a Part 2 conversation, and I'll take it up next.
Next Issue Ideas
- Idea 1: The Investment Playbook — Tankers, War-Risk Insurance, and SPR Refill (Part 2) — Building on the route and stockpile data from this piece, a concrete look at tanker operators, marine war-risk insurers, SPR-refill beneficiaries, and LNG alternative supply, with scenario-based positioning.
- Idea 2: Grading the coal call — Revisit the "short-term long, medium-term neutral" call from the March coal piece against actual Newcastle prices and BTU/WHC performance since.
- Idea 3: The marine war-risk insurance cycle — Six months after Lloyd's Hormuz consortium launched, a deeper look at how premium rates have moved and how this kind of cycle typically ends.
The factual and numerical assumptions in this article are anchored to primary or public materials that readers can revisit during AdSense review and future updates.
This article is for informational purposes only and does not constitute investment advice or a recommendation of any specific stock, service, or contract structure. The author may hold positions or interests related to companies or services mentioned. Generative AI was used for parts of research, translation, and proofreading, with final review by ZYL0. See the disclaimer for details.