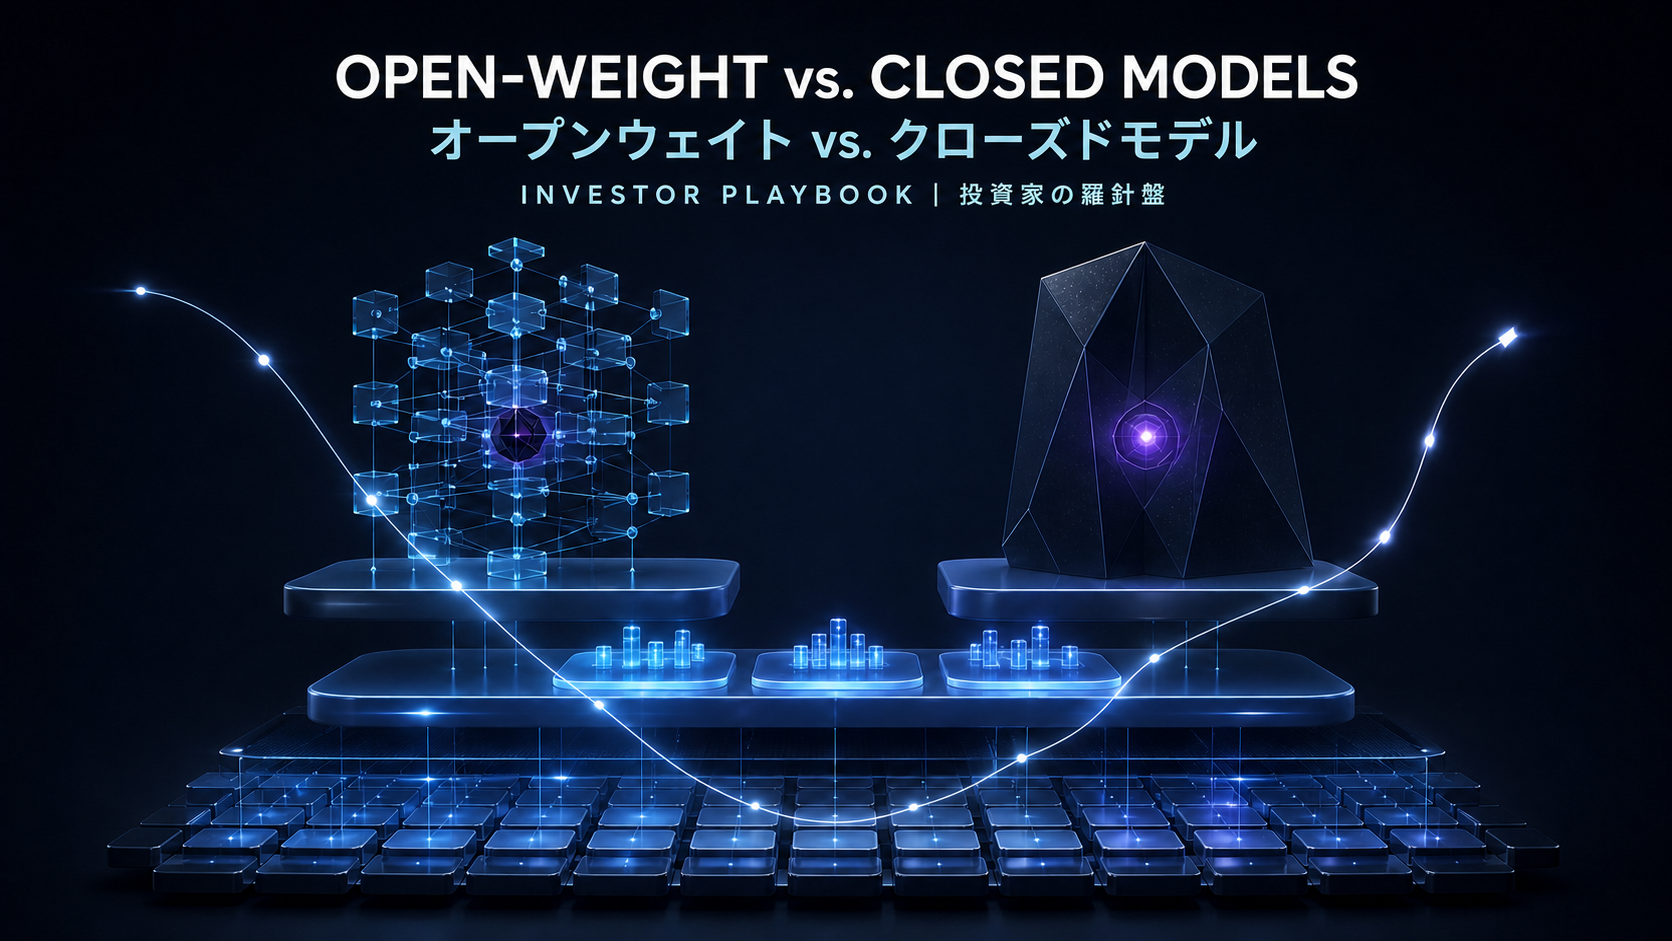
ウォーシュ・ショック[後編]金利上昇はハイテク設備投資をどこまで揺らすか
前編では、ウォーシュFRB議長のジャクソンホール講演を起点に、9月FOMCに向けた金利シナリオとドル円のポジションリスクを整理した。書きながら、ずっと気になっていた問いがある。金利が本当に上がるとして、その負担は結局どこに着地するのか、ということだ。今回はその答えを、2026年に合計約7,250億ドルという規模まで膨らんだハイパースケーラー4社の設備投資に求める。
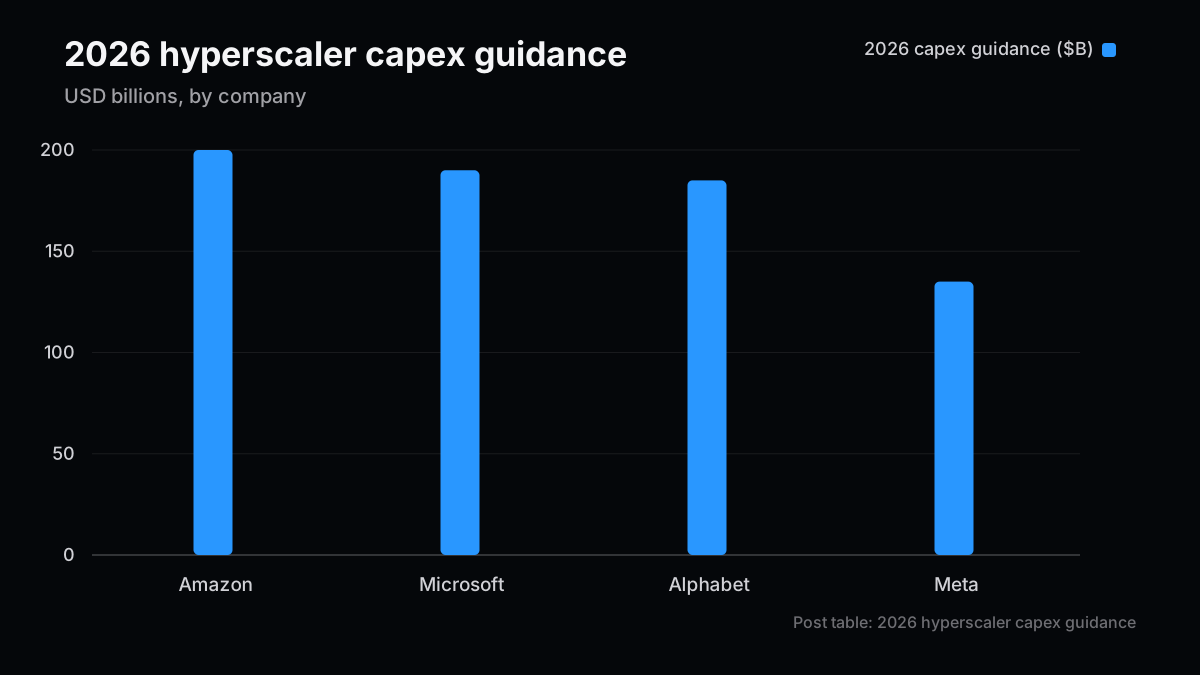
Amazon・Microsoft・Alphabet・Metaの2026年設備投資ガイダンスを並べると、規模感そのものに一度立ち止まってしまう。
| 企業 | 2026年設備投資ガイダンス | 改定内容 |
|---|
| Amazon | 約$200B | ― |
| Microsoft | 約$190B | ― |
| Alphabet | $180〜190B | Q1決算で$175〜190Bから上方修正、2027年も増額を示唆 |
| Meta | $125〜145B | $115〜135Bから上方修正 |
| 合計 | 約$725B | 2025年の約$410Bから前年比+77% |
アナリストの間では、2027年には4社合計で1兆ドルを超えるという見通しも出ている。私が驚いたのは金額の大きさそのものより、4社ともQ1決算のタイミングでガイダンスを「上方修正」していたことだ。金利が上がり始めている局面で、下方修正ではなく上方修正が相次いだという事実は、この設備投資サイクルの勢いを物語っていると思う。
ただし、勢いがあることと、その資金調達が持続可能であることは別の問題だ。次の節では、この規模の投資がどこから調達されているのかを見ていく。
これまでハイパースケーラーの設備投資は、潤沢なフリーキャッシュフロー(FCF)でほぼ内製できるというのが共通認識だった。ここが、この1年でもっとも大きく変わった点だと思う。
| 指標 | FY24 | 2026年LTM(直近12か月) |
|---|
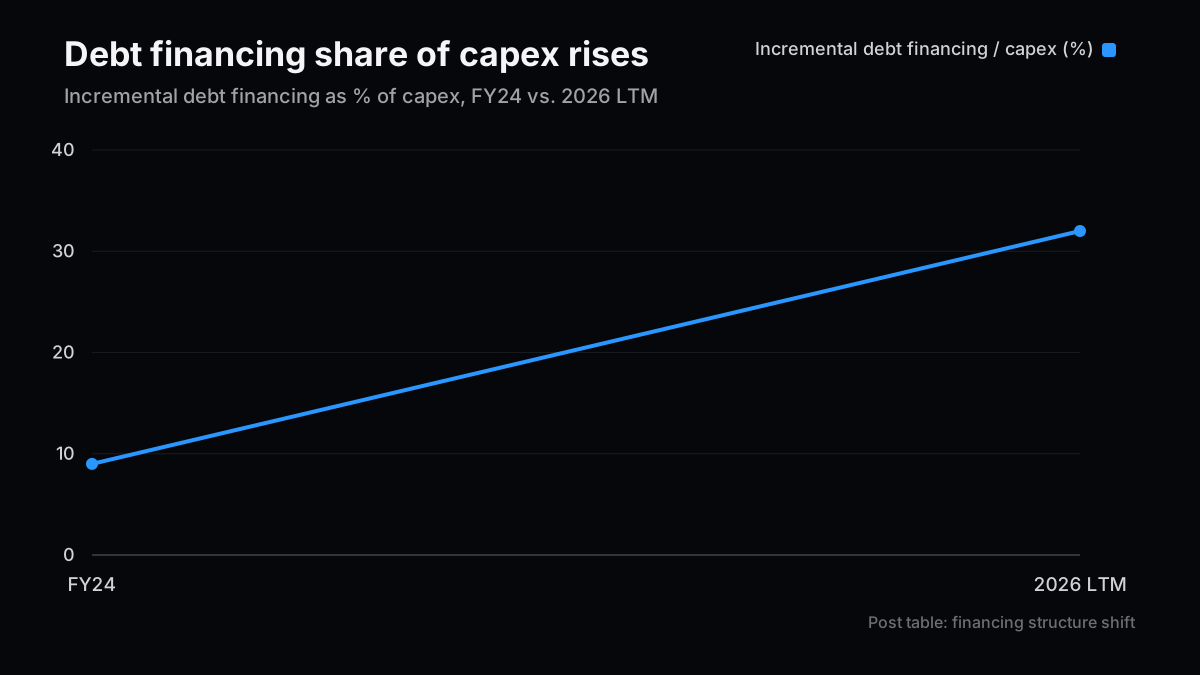
| 増分負債調達/資本支出比率 | 約9% | 約32% |
| Alphabetの負債残高 | 約$16B(1年前) | 約$100B |
| Alphabetのエクイティ調達 | ― | $84.75B(2026年6月に実施) |
| Oracleの2027年度調達計画 | ― | 負債・エクイティ計$40B |
増分負債調達比率がFY24の9%から2026年LTMで32%まで上がったという数字は、率直に言ってこの1年の変化のスピードとして相当に速い。Alphabetの負債残高が1年で$16Bから$100B規模へと膨らみ、さらに$84.75Bものエクイティ調達を実施したという事実は、「AI投資はキャッシュフローで賄える」という去年までの前提が、もはや4社すべてには当てはまらなくなっていることを示している。
自社内でPoC提案から数億円規模の社内決裁を取得し、実行まで主導した経験があるが、社内のハードルレート(社内金利)が数ポイント上がるだけで、同じ事業性のプロジェクトでも承認の通り方がまったく変わるという感覚を持っている。ハイパースケーラーの設備投資も、規模の桁こそ違うが、資金調達コストの上昇が意思決定に効いてくるという構造そのものは同じはずだ。
前編を書いた時点でもっとも直近だったイランタンカー株の後編では、SPR補充を「政府調達という一種の下支え需要」と位置づけた。ハイパースケーラーの設備投資も似た構造を持つ——ただし今回の下支えは政府ではなく、投資家からの負債・エクイティ調達だという違いがある。政府調達には価格弾力性がほとんどないが、投資家からの調達は金利や信用スプレッドに直接反応する。この違いは、次の節で扱う金利感応度の話に直結する。
4社を一括りにして「ハイテク設備投資は金利に弱い」と言うのは、正直やや乱暴だと思う。実態はもう少し分かれている。
| 企業 | FCFの状況 | 金利感応度 |
|---|
| Microsoft | 潤沢なFCFで支出をほぼ内製カバー | 低い |
| Alphabet | エクイティ調達も動員、FCF圧迫を一定程度許容 | 中程度 |
| Amazon | FCF圧迫を許容しつつ支出継続 | 中〜高い |
| Meta | FCF圧迫を許容し、なおガイダンスを上方修正 | 高い |
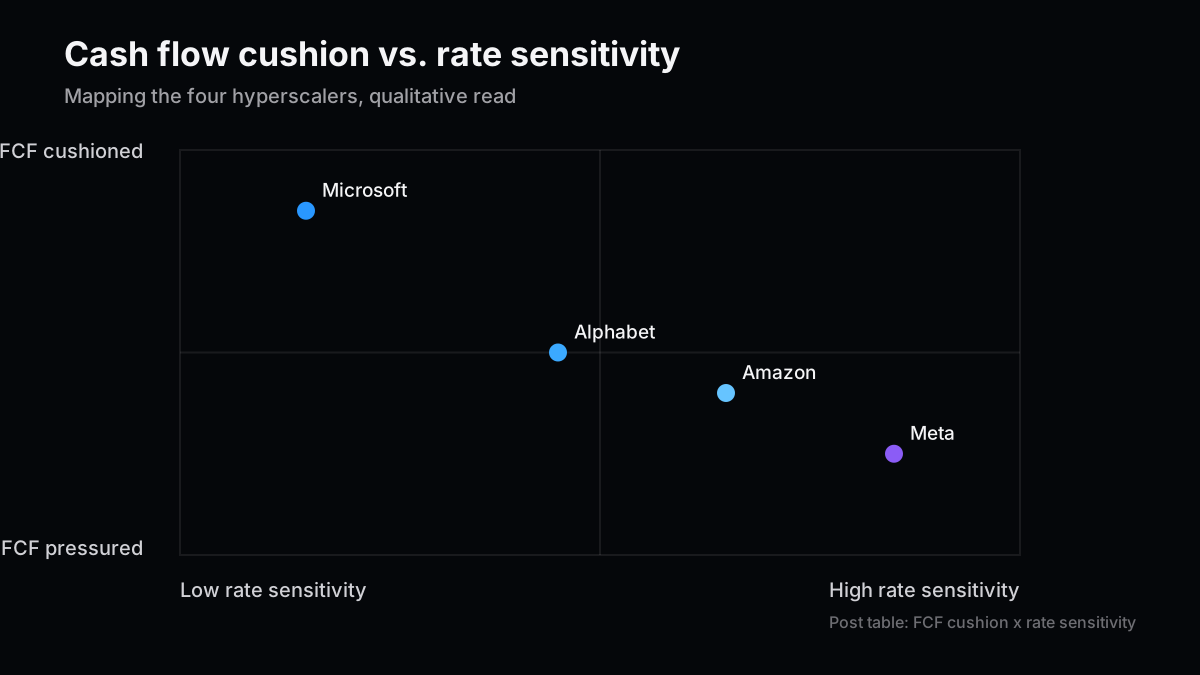
Microsoftが相対的に金利上昇の影響を受けにくいのは、FCFで支出の大半を賄えているからだ。一方、Alphabet・Amazon・Metaは、程度の差はあれ「FCF圧迫を受け入れてでも投資を続ける」という選択をしている。この3社にとって、金利上昇は資金調達コストという形で直接ぶつかってくる変数になる。
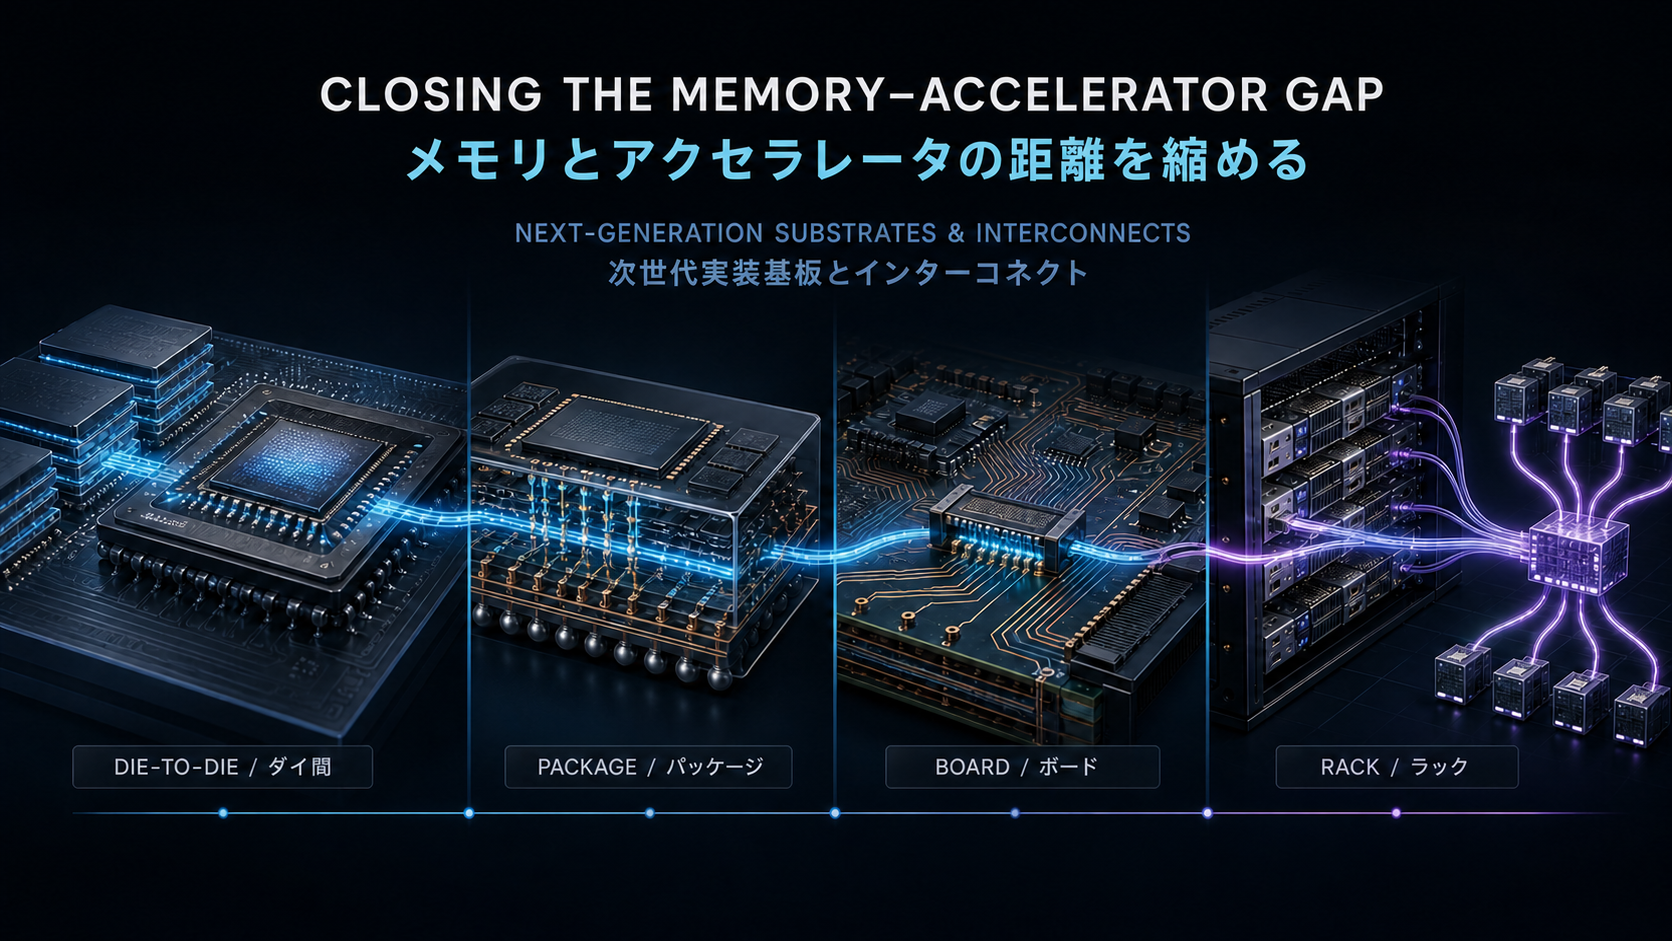
半導体サプライチェーンへの波及も見ておきたい。ハイパースケーラーの設備投資が減速すれば、まず影響を受けるのはNVIDIA等のGPU・アクセラレータ供給網であり、次いでメモリ・電源・冷却といった周辺部材だ。ただし現時点では、4社そろってガイダンスを上方修正しているという事実の方が重い。減速の兆しよりも、資金調達構造の脆弱性の方が、今ウォッチすべき変数だというのが私の見立てだ。
車載プロセス開発者としてTCADによるデバイス設計に携わっていた経験から言うと、半導体の設備投資判断には在庫と歩留まりのタイムラグが長くつきまとう。需要シグナルの変化が実際の生産計画に反映されるまで、ウェハー投入からロット完了まで数四半期のズレが生じやすいからだ。ハイパースケーラーがガイダンスを据え置いたとしても、そのシグナルがNVIDIAやメモリメーカーの発注計画に反映されるのは早くても翌四半期以降になる。したがって、今回のシナリオが仮にメインからテールへシフトしたとしても、半導体サプライチェーンへの実際の影響が数字に表れるのは、金利変化そのものよりも半年ほど遅れて出てくると見ておくのが妥当だと思う。
前編で示した金利シナリオを受けて、設備投資サイクルの行方をベース・メイン・テールの3シナリオに整理する。
| シナリオ | 内容 | 2027年設備投資 | 半導体サプライチェーンへの含意 |
|---|
| ベース:投資継続 | 資金調達コスト上昇を許容し、計画通り実行 | 合計$1兆超を維持 | NVIDIA等への発注は堅調に推移 |
| メイン:一部繰延 | 金利感応度の高い企業がガイダンスを据え置き・微修正 | 増勢鈍化、$900B〜$1兆 | 高付加価値品への選別が強まる |
| テール:大幅減速 | 資金調達コストが急騰し、複数社がガイダンスを引き下げ | 前年比横ばい〜減少 | 装置・部材への発注が広範に減少 |
私自身は、Microsoftを除く3社が示している「FCF圧迫を許容してでも投資を続ける」という姿勢の強さを踏まえると、メインシナリオを一番厚く見ている。ただし、この見立てが崩れる条件も明示しておきたい。9月FOMCでFRBが利上げを見送り、かつハト派的なトーンに転じた場合、資金調達コストへの懸念は大きく後退し、ベースシナリオの確度が上がると考えている。逆に、前編で示したメインシナリオ(9月利上げ)が現実になれば、テールシナリオへの警戒を一段引き上げる必要がある。
金利という一つの変数が、ドル円のポジションから数千億ドル規模の設備投資計画まで波及する——今回の2本を通じて改めて感じたのは、マクロの入り口は一つでも、出口は複数あるということだ。9月FOMCの結果は、両方の記事のシナリオを同時に採点する材料になる。
次号の記事案
- 案1:9月FOMC後、金利と設備投資の答え合わせ — 前編・後編のシナリオを、実際のFOMC結果とハイパースケーラーの決算コメントに照らして採点する。
- 案2:半導体サプライチェーンへの波及を深掘り — NVIDIA・メモリ・電源部材まで、設備投資減速シナリオが顕在化した場合の影響を銘柄レベルで整理する。
- 案3:ハイパースケーラーの社債発行条件を追う — Alphabet・Meta等の起債スプレッドの推移から、資金調達コストの実勢を定点観測する。
本文の事実関係と数値前提は、読者が確認できる一次情報・公的資料を優先して掲載している。
本記事は情報提供を目的としたものであり、特定の銘柄・サービス・契約条件の推奨や投資助言ではありません。執筆者は記事内で言及した銘柄にポジションまたは利害関係を持つ可能性があります。調査、翻訳、校正の一部に生成AIを利用していますが、最終的な内容はZYL0が確認しています。詳細は免責事項をご確認ください。
The Warsh Shock — Part 2: How Far Rate Risk Reaches Into Tech Capex
Part 1 used Kevin Warsh's Jackson Hole speech as the starting point for a rate outlook heading into the September FOMC meeting, plus a read on dollar-yen positioning risk. One question kept nagging at me while writing it: if rates really do rise, where does that burden actually land? This piece looks for the answer in the roughly $725 billion the four hyperscalers now plan to spend on capex in 2026.
Lining up Amazon, Microsoft, Alphabet, and Meta's 2026 capex guidance is worth pausing on before doing anything else with the numbers.
| Company | 2026 capex guidance | Revision history |
|---|
| Amazon | ~$200B | — |
| Microsoft | ~$190B | — |
| Alphabet | $180-190B | Raised from $175-185B at Q1 earnings; flagged a further 2027 increase |
| Meta | $125-145B | Raised from $115-135B |
| Combined | ~$725B | Up 77% from ~$410B in 2025 |
Some analysts already project the combined figure clearing $1 trillion in 2027. What surprised me wasn't the sheer size of these numbers — it was that all four companies raised guidance at their Q1 earnings, in a period when rates were already climbing. Seeing upward revisions rather than downward ones, in that setting, says something about how much conviction is still behind this capex cycle.
Conviction and sustainable financing are two different things, though. The next section looks at where this money is actually coming from.
Until recently, the working assumption was that hyperscaler capex was largely self-funded out of abundant free cash flow. That assumption is the single biggest thing that's changed over the past year.
| Metric | FY24 | 2026 LTM (trailing twelve months) |
|---|
| Incremental debt financing / capex ratio | ~9% | ~32% |
| Alphabet debt balance | ~$16B (a year ago) | ~$100B |
| Alphabet equity raise | — | $84.75B (priced June 2026) |
| Oracle FY27 financing plan | — | $40B combined debt and equity |
Going from a 9% debt-financing ratio in FY24 to roughly 32% on an LTM basis by 2026 is, honestly, a fast pace of change for a single year. Alphabet's debt balance ballooning from roughly $16 billion to about $100 billion, on top of an $84.75 billion equity raise, tells me that "AI capex is fully covered by cash flow" no longer holds for all four names the way it did a year ago.
I once helped take a proof-of-concept proposal through internal sign-off for a project worth several hundred million yen, and what stuck with me is how much a few points on the internal hurdle rate can change whether an otherwise sound project actually gets approved. Hyperscaler capex operates at a very different scale, but the same mechanism should still apply: rising financing costs feed directly into how these decisions get made.
Part 1 of this series, the most recent post at the time I wrote its companion piece on Iran tanker stocks, framed SPR refill purchasing as a form of government demand floor. Hyperscaler capex has a similar structure — except this time the floor is investor-supplied debt and equity, not government purchasing. Government demand is close to price-inelastic; investor-supplied capital reacts directly to rates and credit spreads. That distinction feeds straight into the rate-sensitivity question in the next section.
Lumping all four names together under "tech capex is rate-sensitive" is, frankly, a bit sloppy. The picture splits more than that.
| Company | Cash flow position | Rate sensitivity |
|---|
| Microsoft | Ample FCF covers most of its own spend | Low |
| Alphabet | Tapping equity markets too; accepting some FCF pressure | Moderate |
| Amazon | Accepting FCF pressure while continuing to spend | Moderate to high |
| Meta | Accepting FCF pressure and still raising guidance | High |
Microsoft is relatively insulated from rate risk simply because its own cash flow covers most of the spend. Alphabet, Amazon, and Meta, to varying degrees, have all chosen to keep spending even while accepting real pressure on free cash flow. For those three, rising rates hit them directly, as financing cost.
Worth touching on the semiconductor supply chain here too. A capex slowdown at the hyperscaler level would first hit NVIDIA and the broader GPU/accelerator supply chain, then ripple out to memory, power delivery, and cooling. Right now, though, the fact that all four companies raised guidance in the same period carries more weight than any early sign of a slowdown. My own read is that financing-structure fragility, not a slowdown signal, is the variable actually worth watching today.
Having worked as a device engineer running TCAD-based process simulations for automotive semiconductor lines, I've seen firsthand how long the lag runs between a shift in demand signals and an actual change in fab output plans — wafer starts, yield ramp, and qualification cycles routinely stretch that lag to several quarters. Even if hyperscaler guidance holds flat, that signal typically doesn't reach NVIDIA's or a memory maker's order book until at least the following quarter. So if this scenario set does shift from main toward tail, I'd expect the real semiconductor supply-chain fallout to show up in the numbers roughly two quarters behind the rate move itself, not immediately.
Building on Part 1's rate scenarios, here's how I'd frame the capex cycle across a base/main/tail structure.
| Scenario | Description | 2027 capex | Semiconductor supply chain implication |
|---|
| Base: spending continues | Companies accept higher financing costs and execute as planned | Combined total holds above $1T | Orders to NVIDIA and peers stay firm |
| Main: partial deferral | The more rate-sensitive names hold guidance flat or trim slightly | Growth slows to $900B-$1T | Selection tightens toward higher-value products |
| Tail: sharp slowdown | Financing costs spike; multiple companies cut guidance | Flat to down year over year | Broad-based order cuts to equipment and parts |
Given how firmly Alphabet, Amazon, and Meta have all signaled they'll accept FCF pressure rather than pull back, I weight the main scenario most heavily. Here's the condition that would change my mind: if the Fed holds at the September FOMC and pivots to a dovish tone, financing-cost concerns would recede fast, and the base scenario would gain real credibility. Conversely, if Part 1's main scenario — a September hike — actually plays out, the tail-risk case here deserves more weight, not less.
A single variable, rates, reaches all the way from dollar-yen positioning to capex plans worth hundreds of billions of dollars. Writing these two pieces back to back, what stands out to me is that a macro story can have one entry point and several exits. The September FOMC outcome will grade both articles' scenarios at once.
One more thing worth stating plainly: the four companies here aren't a single trade. Microsoft's low rate sensitivity means it can plausibly keep raising guidance even in a hiking cycle, while Meta's high sensitivity means the same hiking cycle could force a guidance cut within a couple of quarters, not a couple of years. Treating "hyperscaler capex" as one undifferentiated basket risks missing that the four names sit at meaningfully different points on the same rate-sensitivity curve — and that curve, not the headline capex total, is what I'll be tracking most closely into year-end.
Next Issue Ideas
- Idea 1: Grading rates and capex after the September FOMC — Score both this series' scenarios against the actual FOMC outcome and hyperscaler earnings commentary.
- Idea 2: Tracing the semiconductor supply chain spillover — A ticker-level look at NVIDIA, memory, and power-delivery names if a capex slowdown scenario starts to materialize.
- Idea 3: Tracking hyperscaler bond issuance terms — Using Alphabet's and Meta's credit spreads as a running gauge of actual financing costs.
The factual and numerical assumptions in this article are anchored to primary or public materials readers can verify.
This article is for informational purposes only and does not constitute investment advice or a recommendation of any specific security, service, or contract structure. The author may hold positions or interests related to companies discussed. Generative AI was used for parts of research, translation, and proofreading, with final review by ZYL0. See the disclaimer for details.