Big TechのAI設備投資は横並びで比較できない:4社の開示を同じ定義に直す
「GoogleとMeta、AmazonとMicrosoftのどこが一番AIに投資しているのか」——検索から当ブログに来る読者が最も多く打ち込む問いの一つがこれだ。ところが四半期決算の当日にニュースが並べる4つの数字は、そもそも同じものを測っていない。
私がこれを放置できないのは、前職の癖のせいでもある。CVCに移ったとき、投資チームにはDDの品質基準が統一されていなかった。各自が違う定義で「売上」や「投資額」を書いた資料を投資委員会に持ち込み、比較らしい比較にならない。そこで定義を揃えるところから標準化した。EU ETSとTHETIS-MRVの船舶データを扱ったときも同じで、報告主体が違うデータを正規化するまでは、順位を語る意味がなかった。
今回はその作業をBig Tech4社の最新開示でやる。結論から言えば、同じ定義に直すと会社間の差はかなり縮み、しかも4社のうち2社は四半期の設備投資を営業キャッシュフローで賄えていない。
確認時点:2026年9月20日。 数値はAlphabet、Amazon、Microsoft、Metaが米SECに提出した各社の決算リリース(Exhibit 99.1)とMicrosoftのFY26 Q4決算説明から取得した。比較対象は2026年4〜6月期で、MicrosoftのみFY2026第4四半期が同じ暦四半期に当たる。比率は本稿での計算値であり、各社の開示指標ではない。

まず、どこがズレているのかを一枚にする。
| 会社 | 会社が語る四半期capex | キャッシュフロー計算書の有形固定資産取得 | 差分の中身 |
|---|
| Alphabet | 449億ドル | 449億ドル | ファイナンスリースの独立行がない |
| Amazon | 531億ドル | 542億ドル | 売却代金・インセンティブ11億ドルを控除 |
| Microsoft | 414億ドル | 358億ドル | ファイナンスリース56億ドルを加算 |
| Meta | 311億ドル | 301億ドル | リース元本返済10億ドルを加算 |
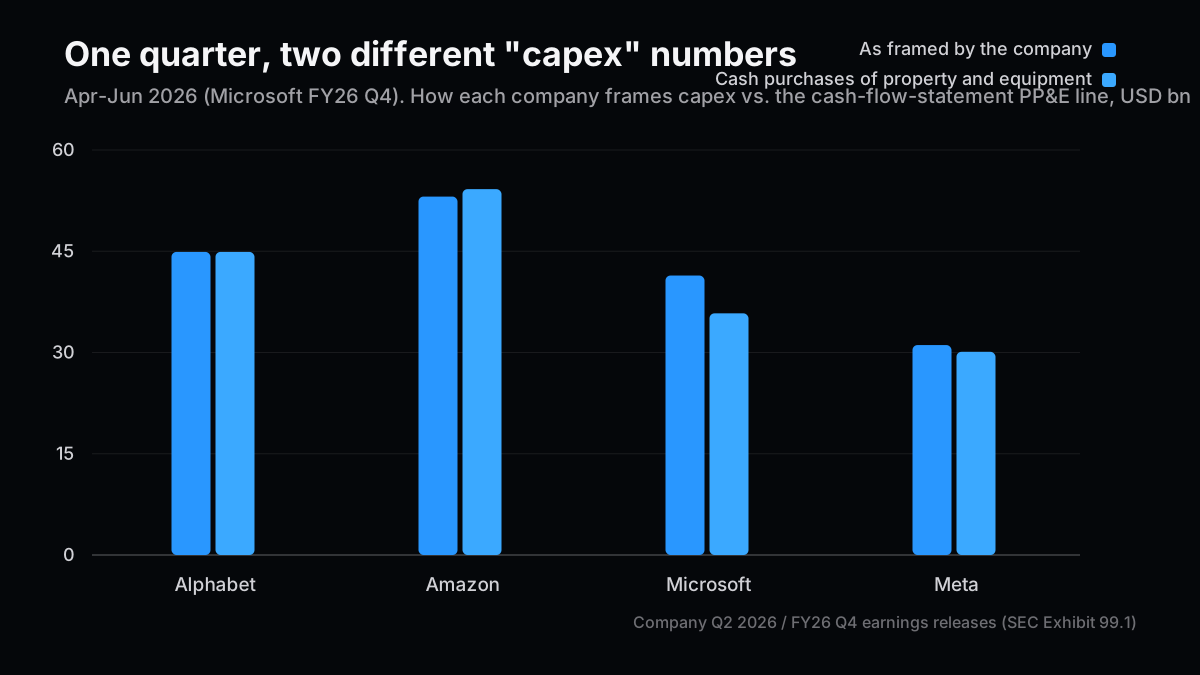
Alphabetは会見でも449億ドルと語っており、2つの列は同じ行を指している。問題はMicrosoftだ。会見で語られる414億ドルのうち56億ドルは現金支出ではなくファイナンスリースであり、現金ベースに直すと358億ドルまで下がる。
順位はこう動く。発表ベースならAmazon、Alphabet、Microsoft、Metaの順。現金ベースに直すとAmazon、Alphabet、Microsoft、Metaで順序自体は保たれるが、MicrosoftとMetaの差は103億ドルから57億ドルへ、ほぼ半分に縮む。「MicrosoftはMetaの1.3倍投じている」と「1.19倍だ」では、読み手の受け取り方はかなり違う。
Q1 2026の4社比較では、私はこの差を十分に扱わなかった。当時は合算6,000億ドルという規模の話が主題で、定義の話は脇に置いた。半年たって規模がさらに膨らんだ今、脇に置いたままにはできない。
正規化の手順は単純だ。各社の決算リリースのキャッシュフロー計算書から、現金で出て行った有形固定資産取得の行だけを拾う。会見の数字は使わない。
| 指標(2026年4〜6月期) | Alphabet | Amazon | Microsoft | Meta |
|---|
| 売上高(億ドル) | 1,198 | 2,006 | 900 | 608 |
| 営業利益(億ドル) | 408 | 275 | 406 | 188 |
| 営業キャッシュフロー | 391 | 454 | 554 | 319 |
| 現金ベースの有形固定資産 | 449 | 542 | 358 | 301 |
| ファイナンスリース元本返済 | 開示なし | 4 | 56 | 10 |
この表で先に目が行くのは売上高だろう。Amazonの2,006億ドルはMetaの3.3倍ある。規模が違う会社の設備投資額を絶対額で並べても、投資の重さは分からない。だから売上比と営業キャッシュフロー比に直す。
# 2026年4-6月期。単位は10億ドル。各社の決算リリース(SEC Exhibit 99.1)から取得。
q = {
    "Alphabet":  {"rev": 119.796, "ocf": 39.069, "ppe": 44.924, "lease": None},
    "Amazon":    {"rev": 200.600, "ocf": 45.387, "ppe": 54.208, "lease": 0.395},
    "Microsoft": {"rev":  90.007, "ocf": 55.441, "ppe": 35.802, "lease": 5.600},
    "Meta":      {"rev":  60.801, "ocf": 31.862, "ppe": 30.116, "lease": 0.962},
}

for name, v in q.items():
    intensity = v["ppe"] / v["rev"] * 100
    coverage = v["ppe"] / v["ocf"] * 100
    with_lease = (v["ppe"] + (v["lease"] or 0)) / v["ocf"] * 100
    print(f"{name:10} {intensity:5.1f}% {coverage:6.1f}% {with_lease:6.1f}%")
| 会社 | 現金設備投資÷売上 | 現金設備投資÷営業CF | リース込み÷営業CF |
|---|
| Alphabet | 37.5% | 115.0% | (開示なし) |
| Amazon | 27.0% | 119.4% | 120.3% |
| Microsoft | 39.8% | 64.6% | 74.7% |
| Meta | 49.5% | 94.5% | 97.5% |
売上比で最も重いのはMetaの49.5%だ。売上の半分を設備に回している。だが営業キャッシュフローとの関係を見ると、Metaは94.5%で辛うじて内側に収まり、AlphabetとAmazonは100%を超えている。この四半期、両社は稼いだ営業キャッシュフローより多くの現金を設備に払った。
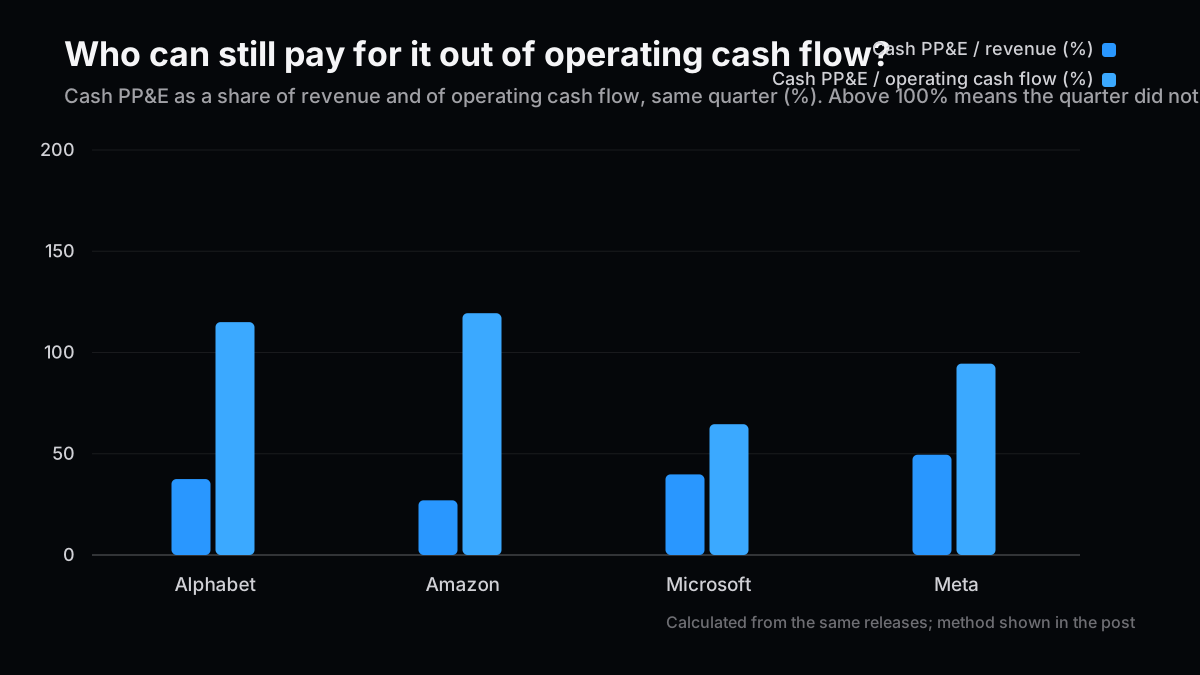
Microsoftだけが64.6%と余裕を残している。ただしリースを戻すと74.7%まで上がる。ここが今回いちばん気になった点だ。Microsoftは将来のデータセンター賃借をファイナンスリースからオペレーティングリースへ移す会計上の整理を進めており、オペレーティングリースはcapexに含まれない。定義の線が動けば、支出の実態が変わらなくても開示上のcapexは下がる。
規模の話に慣れすぎると、支払い原資の話を飛ばしてしまう。私はここで一度立ち止まった。
Alphabetの四半期は、営業キャッシュフロー391億ドルに対して設備投資449億ドル。差は約59億ドルだ。単独四半期なら運転資本や手元資金で吸収できる範囲に見える。しかし同社は2026年6月に普通株と強制転換型優先株で純額496億ドルを調達し、さらに上期に米ドル建て200億ドルと外貨建て318億ドルの社債を発行している。10-Qは調達目的に「AIインフラと世界的な計算基盤を拡大するための設備投資を含む一般事業目的」と書いている。
これはAI capexと金利リスクの記事で扱った論点が現実になった形だ。自己資金で回る限り、AI設備投資は株主にとって「利益の使い道」の問題でしかない。外部調達が入ると、金利と希薄化の問題に変わる。
利益の比較も同じくらい危うい。この四半期、Alphabetの純利益は1,122億ドルで営業利益408億ドルの2.7倍に達した。差の大半は保有株式の未実現評価益980億ドルである。Amazonの純利益626億ドルにも、Anthropic投資を主因とする税引前の営業外収益534億ドルが含まれる。
| 会社 | 営業利益(億ドル) | 純利益(億ドル) | 純利益に含まれる主な一過性要因 |
|---|
| Alphabet | 408 | 1,122 | 保有株式の未実現評価益 約980億ドル |
| Amazon | 275 | 626 | Anthropic投資等の営業外収益 534億ドル |
| Microsoft | 406 | 358 | 大きな一過性要因の記載なし |
| Meta | 188 | 158 | 大きな一過性要因の記載なし |
純利益でPERを計算して「Alphabetが割安」と言うのは、この四半期に限っては成立しない。AI企業への出資を評価益として取り込む構造が、AI設備投資を評価する分母と分子の両方を歪めている。
AmazonとMicrosoftが通期見通しを引き上げた理由がメモリ価格だったことも、ここに重なる。メモリのロックイン構造で見たとおり、調達価格は数年単位の契約で決まりつつある。支出の伸びが数量なのか単価なのかは、capexの総額からは読み取れない。
四半期で定義がズレるなら、通期ガイダンスはもっとズレる。
| 会社 | 2026年の見通し | 定義 | 直近の変更 |
|---|
| Amazon | 約2,200億ドル | capital investments(リース含む) | 2,000億ドルから増 |
| Alphabet | 1,950〜2,050億ドル | 有形固定資産取得 | 1,800〜1,900から増 |
| Microsoft | 約1,750億ドル(暦年) | ファイナンスリース込み・リース再分類後 | 再分類で下方調整 |
| Meta | 1,300〜1,450億ドル | ファイナンスリース元本返済を含む | 1,250〜1,450から幅を縮小 |
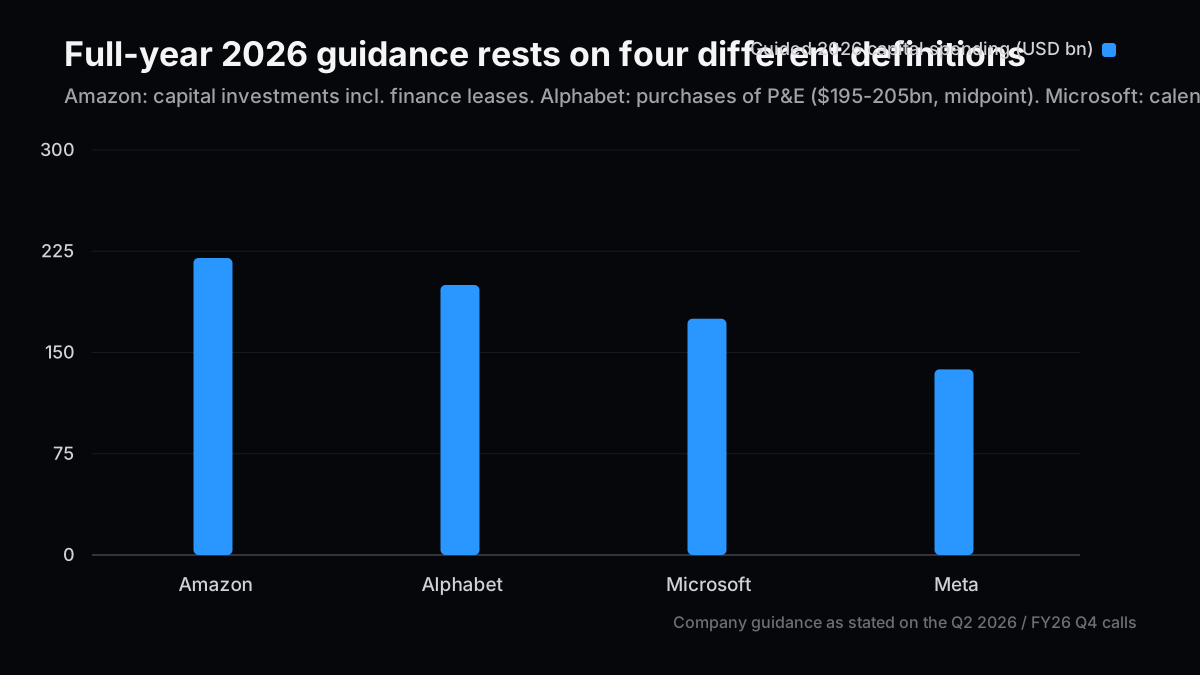
一点補足しておく。この表のうち決算リリース本文に通期レンジが明記されているのはMetaだけで、Alphabet、Amazon、Microsoftの通期見通しは決算説明会での発言である。四半期の実績値と同じ強度の開示ではない。
中点を単純合計すると約7,325億ドルになる。だが、この数字を「4社のAI投資額」として引用するのは避けたい。Amazonとの比較でMicrosoftの1,750億ドルにはリースが含まれ、Alphabetの2,000億ドルには含まれない。しかもMicrosoftの数字は暦年、他社は会計年度だ。足し算は成立していない。
第2四半期の実績から粗く直すなら、Microsoftのリース比率(56÷414=13.5%)とMetaのリース比率(10÷311=3.2%)を通期に当てはめて現金ベースへ引き直す方法がある。その場合、Microsoftは約1,513億ドル、Metaは約1,332億ドルとなり、合計は約7,046億ドルまで下がる。これは私の仮定に基づく試算で、各社のガイダンスではない。四半期のリース比率が通期で一定である保証はどこにもない。
書きながら、自分が過去に混ぜていたものを3つ見つけた。
- 支出とキャッシュアウトの混同。ファイナンスリースは支出だが、その期の現金流出とは一致しない。
- 会計年度と暦年の混同。Microsoft FY26 Q4は2026年4〜6月期であり、同社の「暦年2026年」ガイダンスは別の期間を指す。
- 投資額と投資効率の混同。絶対額の順位は規模の順位に引きずられる。Amazonが最大なのは、売上も最大だからでもある。
現時点では次の3本で追うのが妥当だと考えている。
| シナリオ | 条件 | 確認する一次情報 | 投資への含意 |
|---|
| Base | AlphabetとAmazonの営業CF超過が1〜2四半期で解消 | 四半期の営業CFと有形固定資産取得の差 | 現状の評価を維持 |
| Main | 超過が継続し、社債・株式による調達が定例化 | 起債・エクイティ発行の頻度と規模、支払利息 | 金利感応度が上がり、希薄化を織り込む |
| Tail risk | 定義変更でcapexが見かけ上減り、実支出は減らない | リース分類の変更、オペレーティングリース残高の増加 | 開示capexだけを追う投資判断が機能しなくなる |
投資判断としては、私は4社を同じ「AI設備投資銘柄」として扱うのをやめた。現金ベースで営業キャッシュフローの3分の2に収まっているMicrosoftと、外部調達を始めたAlphabetでは、同じ支出額でもリスクの質が違う。短期は中立、中期は自己資金比率が高い側を厚めに持つ。
この見立てが崩れる条件も書いておく。AlphabetとAmazonが次の2四半期で、新規の外部調達なしに営業キャッシュフローの範囲内へ設備投資を戻した場合、私の「資金調達局面に入った」という読みは誤りになる。逆に、4社が現金ベースのcapexとリースを分けて開示するようになれば、本稿の作業自体が不要になる。それが一番望ましい。
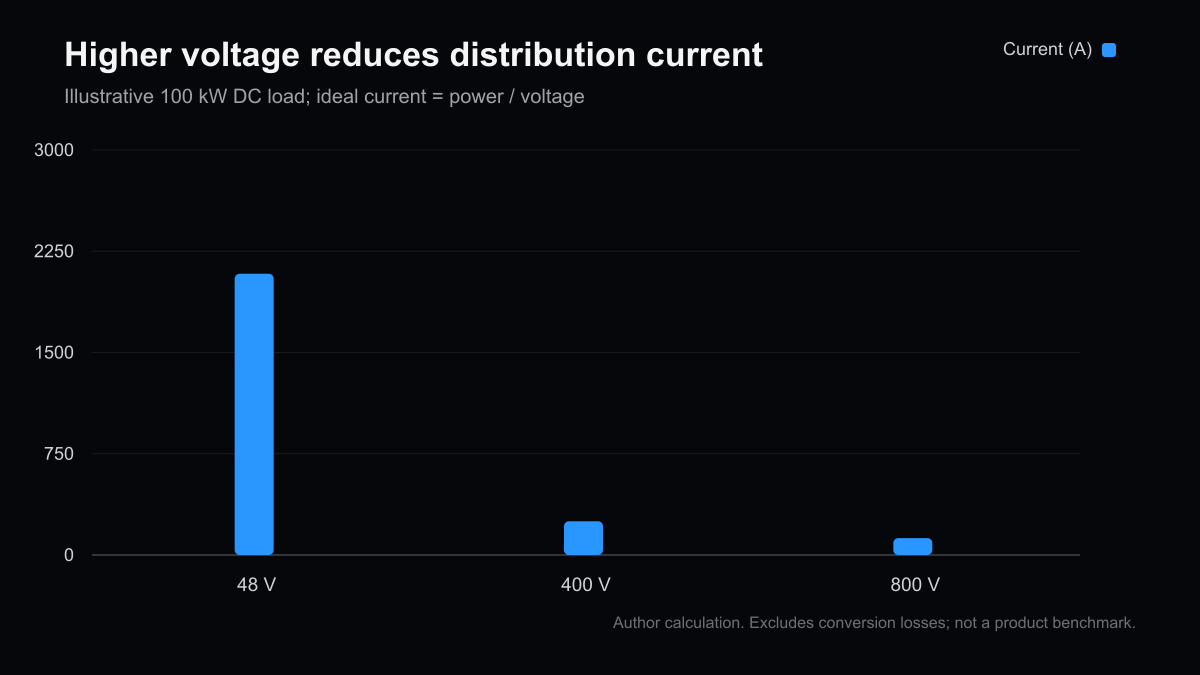
支出の行き先そのものは、800Vデータセンターの記事で見た電力設備や、メモリ・基板といった物理層に落ちていく。金額の正規化は入口にすぎない。
次号の記事案
- 案1:オペレーティングリースに移った支出を追う — 貸借対照表のリース残高と将来支払額から、capex開示の外側に出た金額を四半期ごとに復元する。
- 案2:AI出資の評価益を除いた実力ベースのPER — AlphabetとAmazonの純利益から一過性の評価益を除き、同じ条件で4社のバリュエーションを引き直す。
- 案3:設備投資の回収期間を減価償却年数から逆算する — 耐用年数の変更が利益率に与える影響を、各社の開示だけで比較する。
本記事は情報提供を目的とし、特定銘柄の売買を推奨するものではありません。筆者が記載企業の証券を保有する可能性があります。調査・執筆・翻訳に生成AIを利用しています。比率と試算は本文に明示した仮定に基づく計算値であり、各社の開示指標や将来の財務結果を保証しません。詳細は免責事項をご確認ください。
Big Tech AI Capex Is Not Comparable As Reported: Restating Four Disclosures on One Definition
"Which of them is actually spending the most on AI — Google, Meta, Amazon or Microsoft?" It is one of the most common questions that brings readers to this blog from search. The trouble is that the four numbers the headlines line up on earnings day are not measuring the same thing.
I cannot let that slide, partly out of an old habit. When I moved into corporate venture capital, the investment team had no shared quality standard for diligence. People brought memos to the investment committee using their own definitions of "revenue" and "investment", and the comparisons were not really comparisons. I standardised the definitions first. The same thing happened when I worked with EU ETS and THETIS-MRV shipping data: until I had normalised filings from different reporting entities, ranking them was meaningless.
So let me run that exercise on the four most recent Big Tech disclosures. The short version: restating them onto one definition compresses the gaps, and two of the four did not cover the quarter's capital spending with operating cash flow.
As of 20 September 2026. Figures are taken from each company's earnings release filed with the SEC (Exhibit 99.1) and from Microsoft's FY26 Q4 earnings materials. The comparison quarter is April–June 2026; for Microsoft that is fiscal 2026 Q4, which covers the same calendar period. Ratios are my calculations, not disclosed company metrics.
Here is where the definitions diverge.
| Company | Capex as the company frames it | Cash purchases of property and equipment | What sits in the gap |
|---|
| Alphabet | $44.9bn | $44.9bn | No separate finance-lease line in the cash flow |
| Amazon | $53.1bn | $54.2bn | $1.1bn of sale proceeds and incentives netted |
| Microsoft | $41.4bn | $35.8bn | $5.6bn of finance leases added |
| Meta | $31.1bn | $30.1bn | $1.0bn of finance-lease principal added |
Alphabet's $44.9bn is simply its $44.9bn of property-and-equipment purchases with no lease adjustment, so both columns point at the same line. Microsoft is the interesting one. Of the $41.4bn discussed on the call, $5.6bn is finance leases rather than cash out the door, and the cash figure is $35.8bn.
The ordering barely moves — Amazon, Alphabet, Microsoft, Meta on either basis — but the distances do. The gap between Microsoft and Meta narrows from $10.3bn to $5.7bn, roughly by half. "Microsoft is outspending Meta by 1.3x" and "by 1.19x" land very differently on a reader.
In the Q1 2026 comparison I did not give this enough room. The story then was the sheer scale of a combined $600bn, and the definitional point went into a footnote in my head. Six months and a much larger number later, it cannot stay there.
The method is deliberately dull. Take only the cash line for purchases of property and equipment from each company's own cash flow statement. Ignore what was said on the call.
| Metric (Apr–Jun 2026) | Alphabet | Amazon | Microsoft | Meta |
|---|
| Revenue ($bn) | 119.8 | 200.6 | 90.0 | 60.8 |
| Operating income ($bn) | 40.8 | 27.5 | 40.6 | 18.8 |
| Operating cash flow ($bn) | 39.1 | 45.4 | 55.4 | 31.9 |
| Cash property and equipment | 44.9 | 54.2 | 35.8 | 30.1 |
| Finance-lease principal ($bn) | not disclosed | 0.4 | 5.6 | 1.0 |
The first thing that jumps out is the revenue line. Amazon is 3.3x the size of Meta. Comparing absolute spending across companies of that different a size tells you very little about how heavy the investment is, so the next step is to scale it.
# April-June 2026, USD billions, from each company's earnings release (SEC Exhibit 99.1).
q = {
    "Alphabet":  {"rev": 119.796, "ocf": 39.069, "ppe": 44.924, "lease": None},
    "Amazon":    {"rev": 200.600, "ocf": 45.387, "ppe": 54.208, "lease": 0.395},
    "Microsoft": {"rev":  90.007, "ocf": 55.441, "ppe": 35.802, "lease": 5.600},
    "Meta":      {"rev":  60.801, "ocf": 31.862, "ppe": 30.116, "lease": 0.962},
}

for name, v in q.items():
    intensity = v["ppe"] / v["rev"] * 100
    coverage = v["ppe"] / v["ocf"] * 100
    with_lease = (v["ppe"] + (v["lease"] or 0)) / v["ocf"] * 100
    print(f"{name:10} {intensity:5.1f}% {coverage:6.1f}% {with_lease:6.1f}%")
| Company | Cash capex / revenue | Cash capex / operating CF | Including leases |
|---|
| Alphabet | 37.5% | 115.0% | not disclosed |
| Amazon | 27.0% | 119.4% | 120.3% |
| Microsoft | 39.8% | 64.6% | 74.7% |
| Meta | 49.5% | 94.5% | 97.5% |
By revenue, Meta carries the heaviest load at 49.5% — roughly half of every dollar of sales. Measured against operating cash flow, though, Meta stays just inside at 94.5%, while Alphabet and Amazon are both above 100%. In this quarter, each of them paid out more cash for property and equipment than operations generated.
Only Microsoft keeps real headroom at 64.6%, and even that rises to 74.7% once finance leases are added back. This is the part that nags at me. Microsoft is moving more of its future data centre leases from finance leases to operating leases, and operating leases are not included in capex at all. When the definitional line moves, reported capex can fall without a single dollar of real spending changing.
Spend enough time on the size of the number and you skip the question of where the money comes from. I stopped here for a while.
Alphabet generated $39.1bn of operating cash flow in the quarter and spent $44.9bn on property and equipment — a $5.9bn shortfall. On its own, that is the kind of gap working capital absorbs. But in June 2026 the company raised net proceeds of $49.6bn in Class A and Class C stock plus mandatory convertible preferred stock, on top of $20.0bn of dollar notes and $31.8bn of foreign-currency notes issued in the first half. The 10-Q states the purpose as general corporate purposes "including capital expenditures to scale AI infrastructure and global compute".
That is the scenario I sketched in the piece on AI capex and rate risk turning concrete. While the spending is self-funded, AI capex is a question about how profits get used. Once external funding enters, it becomes a question about interest rates and dilution.
Comparing profits is just as treacherous this quarter. Alphabet's net income of $112.2bn is 2.7x its $40.8bn of operating income, and most of the difference is roughly $98.0bn of unrealised gains on equity securities. Amazon's $62.6bn of net income includes $53.4bn of pre-tax non-operating income, primarily from its Anthropic investments.
| Company | Operating income | Net income | Main one-off inside net income |
|---|
| Alphabet | $40.8bn | $112.2bn | ~$98.0bn of unrealised equity gains |
| Amazon | $27.5bn | $62.6bn | $53.4bn of non-operating income (Anthropic) |
| Microsoft | $40.6bn | $35.8bn | No comparable one-off disclosed |
| Meta | $18.8bn | $15.8bn | No comparable one-off disclosed |
Running a P/E off reported net income and concluding that Alphabet looks cheap does not work for this quarter. Marking up stakes in AI companies distorts both the numerator and the denominator of the thing we are trying to value.
It also matters that Amazon and Microsoft both attributed part of their raised outlook to memory prices. As the memory lock-in piece argued, procurement prices are increasingly set in multi-year agreements. A capex total cannot tell you whether growth in spending is volume or unit price.
If the definitions drift within a quarter, annual guidance drifts further.
| Company | 2026 outlook | Definition | Recent change |
|---|
| Amazon | ~$220bn | Capital investments including finance leases | Raised from ~$200bn |
| Alphabet | $195–205bn | Purchases of property and equipment | Raised from $180–190bn |
| Microsoft | ~$175bn (calendar) | Includes finance leases, after the lease reclassification | Adjusted down by the reclassification |
| Meta | $130–145bn | Includes principal payments on finance leases | Narrowed from $125–145bn |
One caveat on that table: Meta is the only one of the four that states its full-year range in the press release itself. The Alphabet, Amazon and Microsoft figures come from their earnings calls, which is not the same standard of disclosure as a reported quarterly number.
Add the midpoints and you get about $732bn. I would not quote that as "what the four are spending on AI". Microsoft's $175bn includes leases and Alphabet's $200bn does not; Microsoft's figure is a calendar year while the others are fiscal. The addition does not hold.
A rough restatement is possible using the Q2 lease share — 13.5% for Microsoft ($5.6bn of $41.4bn) and 3.2% for Meta ($1.0bn of $31.1bn) — applied to the full year. That would put Microsoft near $151bn and Meta near $133bn, for a total closer to $705bn. That is a scenario built on my assumption, not company guidance, and nothing says a single quarter's lease share holds for twelve months.
Writing this, I caught three things I used to blur together.
- Spending versus cash out. A finance lease is spending, but it is not the same as cash leaving in that period.
- Fiscal versus calendar years. Microsoft's FY26 Q4 is April–June 2026, while its "calendar 2026" guidance covers a different window.
- Amount versus intensity. Absolute rankings track company size. Amazon is the largest spender partly because it is the largest company.
Three paths are worth tracking from here.
| Scenario | Condition | Primary source to check | Investment implication |
|---|
| Base | Alphabet's and Amazon's cash-flow shortfall closes in 1–2 quarters | Quarterly operating cash flow versus PP&E purchases | Current assessment stands |
| Main | The shortfall persists and debt or equity issuance becomes routine | Frequency and size of issuance, interest expense | Rate sensitivity rises; price in dilution |
| Tail risk | Definitional change shrinks reported capex while spending does not | Lease classification changes, operating-lease balances | Following disclosed capex alone stops working |
On positioning, I have stopped treating the four as one "AI capex trade". Microsoft, spending about two-thirds of operating cash flow on a cash basis, and Alphabet, which has started raising outside money, carry different kinds of risk at similar dollar amounts. Neutral over the next quarter; over the medium term I would weight toward the names funding it internally.
Here is what would change my mind: if Alphabet and Amazon bring capital spending back inside operating cash flow over the next two quarters without new external funding, my reading that they have entered a financing phase is simply wrong. And if all four begin disclosing cash capex and leases separately, this whole exercise becomes unnecessary — which would be the best outcome.
Where the money physically lands — the power equipment covered in the 800V data centre piece, and memory and substrates — is the next layer down. Normalising the dollars is only the entrance.
Next Issue Ideas
- Idea 1: Tracking the spending that moved into operating leases — Reconstruct, quarter by quarter, how much sits outside disclosed capex using lease balances and future payment schedules.
- Idea 2: P/E without the AI investment marks — Strip the one-off equity gains out of Alphabet's and Amazon's net income and re-run the four valuations on one basis.
- Idea 3: Payback periods implied by depreciation lives — Compare how useful-life changes flow into margins, using only what each company discloses.
This article is for information only and is not a recommendation to buy or sell any security. The author may hold positions in the companies mentioned. Generative AI was used for research, drafting and translation. Ratios and estimates are calculations based on assumptions stated in the text and do not represent disclosed company metrics or guarantee future financial results. See the disclaimer for details.