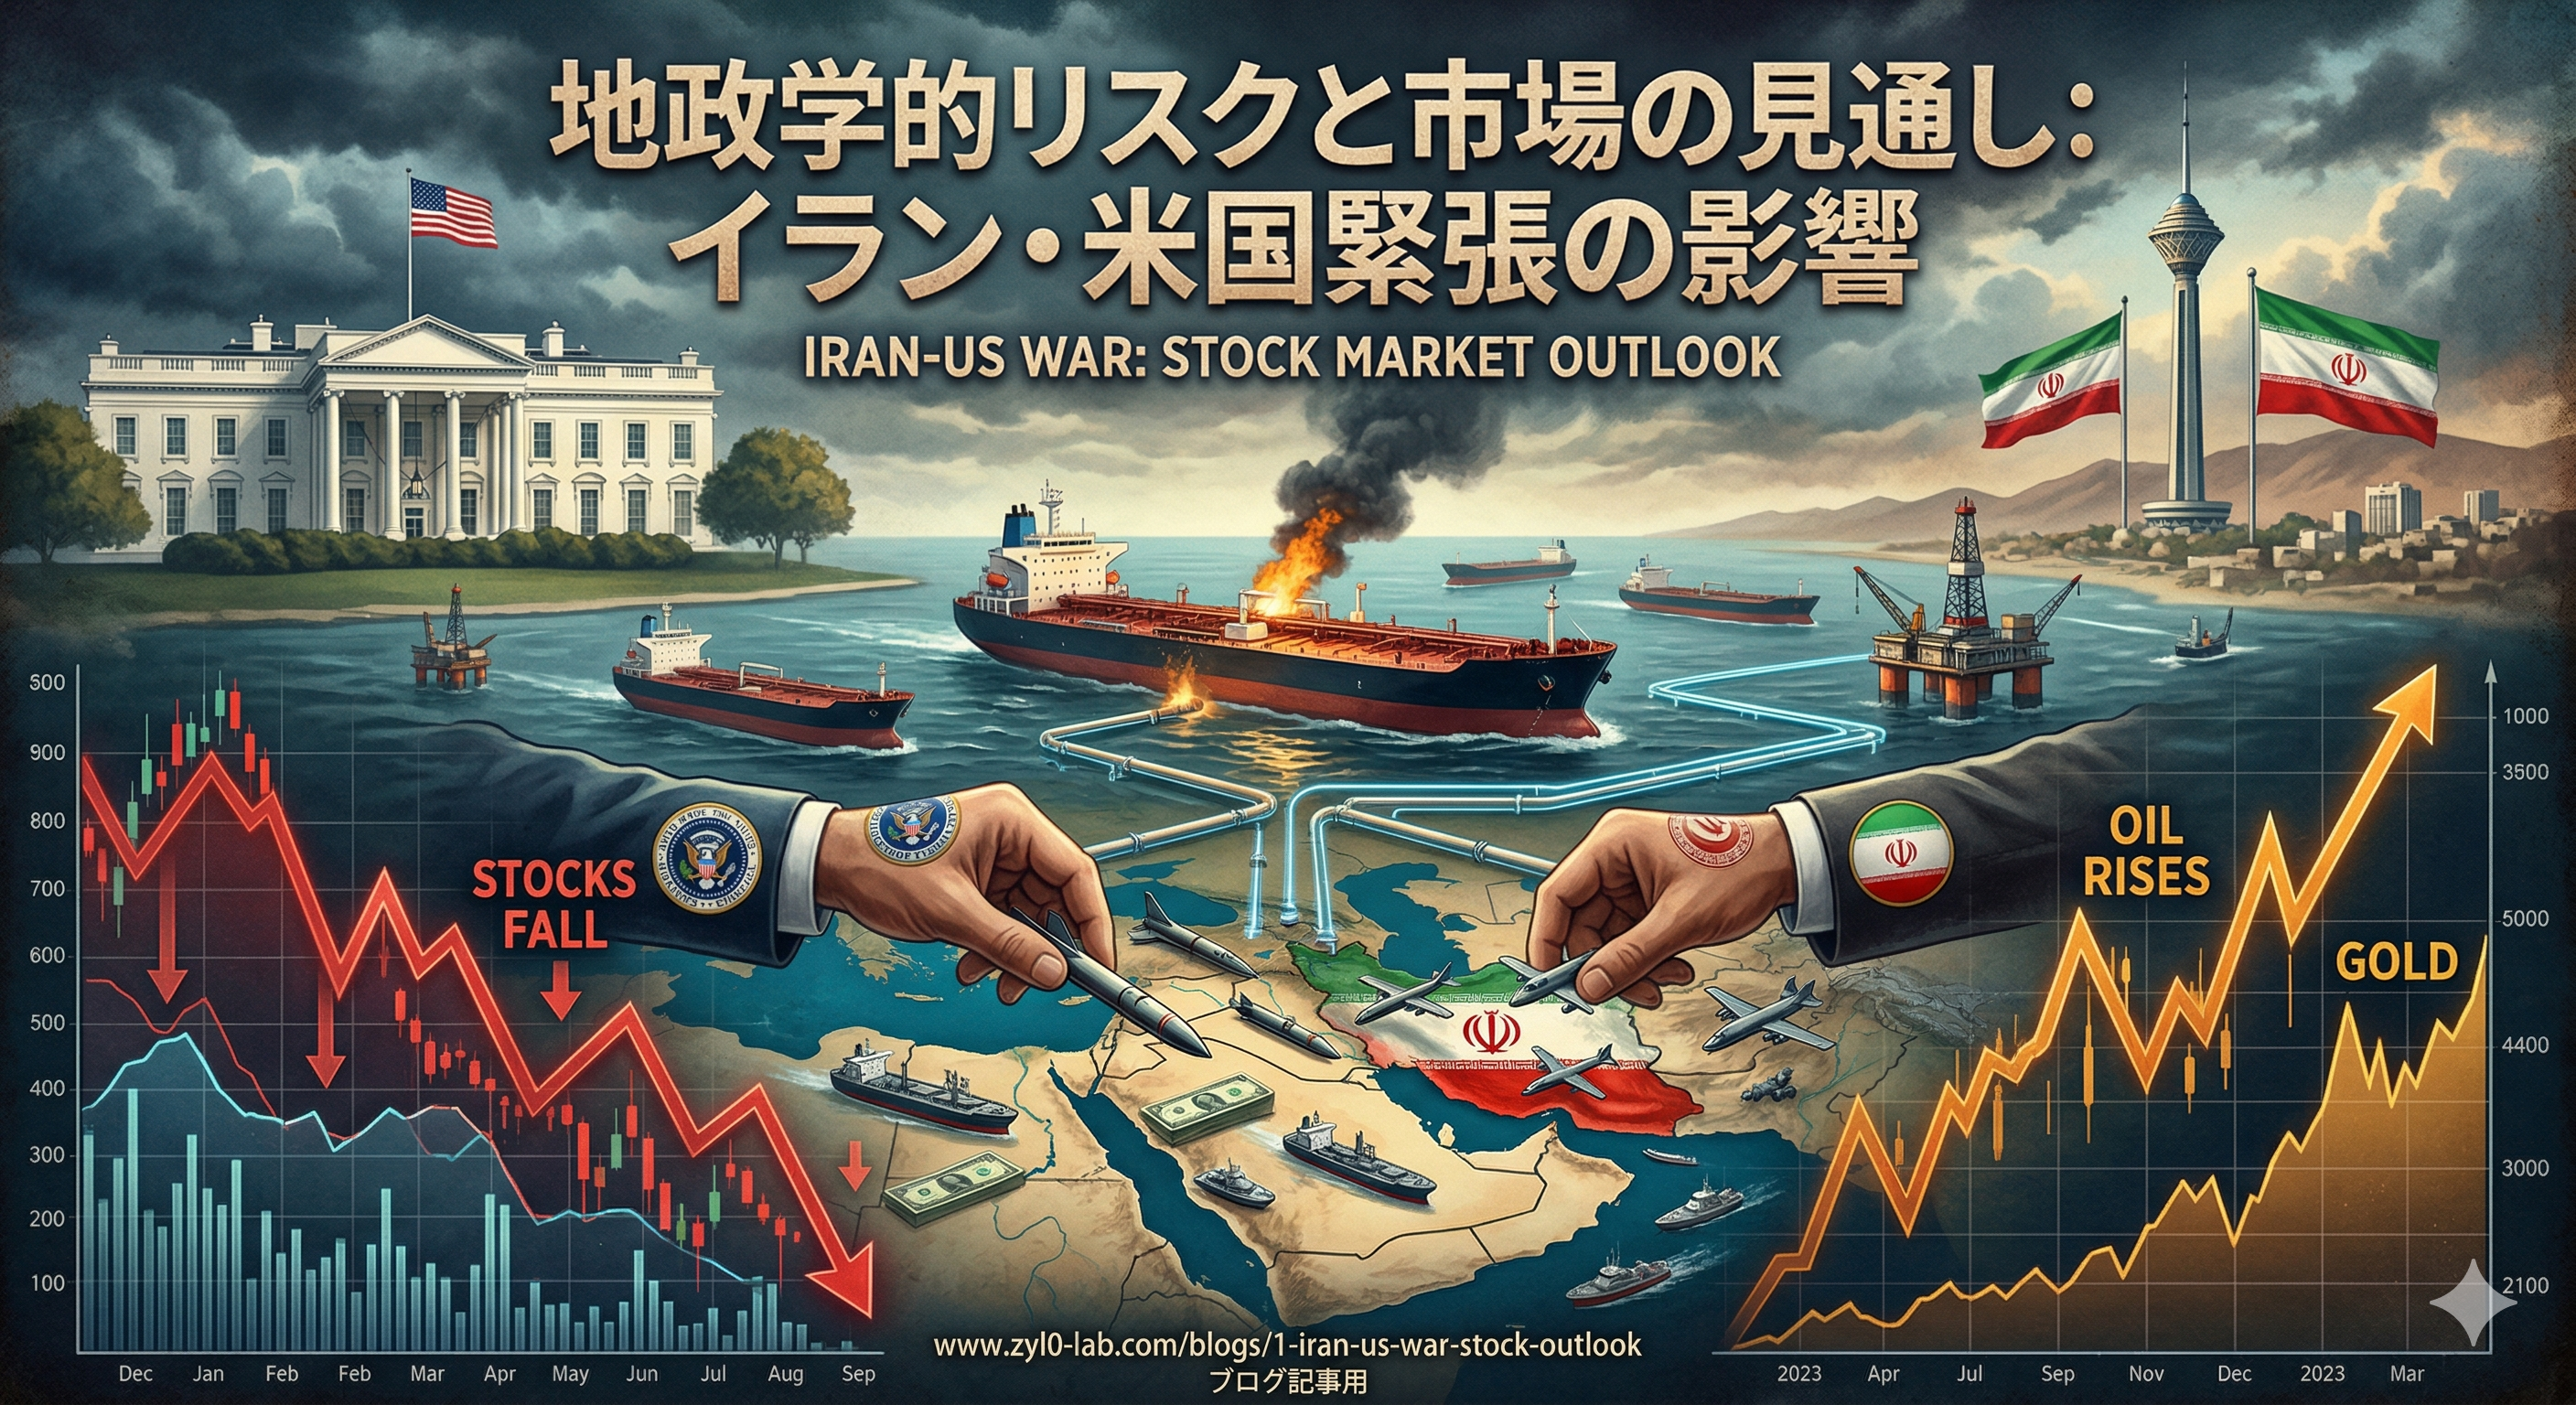
イラン・米国緊張が揺るがす米国株の行方
私はCVCで海洋・エネルギー領域のディール分析を続けてきた人間です。中東情勢は「ニュースの見出し」ではなく、原油・LNG・運賃・配船パターンが連動して動く一個の系として見るのが現実的だと思っています。今回イランと米国の緊張が再燃した局面で、その視点でポートフォリオをどう組み替えるべきかを、自分の実務感覚も交えて書いてみます。
ここで一度、市場が織り込み始めたリスクの中身をフラットに眺めておきたいです。
JCPOA崩壊以降、イラン・米国は「断続的な緊張+限定的衝突」という、どっちつかずの状態が常態化してきましたよね。2026年初からは、複数の要因が同時並行で悪化していて、これが市場のリスクプレミアムを押し上げている、というのが現状の見立てです。
| 要因 | 内容 | 市場への含意 |
|---|
| 核開発加速 | 濃縮ウラン蓄積量が国際的警戒水準を超過 | 制裁強化観測 → 原油・防衛株プラス |
| ホルムズ海峡の緊張 | 世界の原油輸送の約20%が通過 | 海上保険料・運賃上昇 |
| 米軍の中東増強 | 空母打撃群派遣・地域基地強化 | 防衛株モメンタム |
| 代理勢力の活発化 | フーシ派・ヒズボラ等のエスカレーション | サプライチェーン分断リスク |
| 外交チャネルの閉塞 | 直接対話の欠如、第三国経由の間接交渉も停滞 | 不確実性プレミアムが剥がれにくい |
特に海上保険料の上昇は私の中では今回いちばん「実体」に近いシグナルだと感じていて、ここが上抜けてくると、ニュースよりも先に船社・トレーダーの行動が変わり始めます。VLCC・LNG船の用船料スプレッドが広がり始めたら、株式市場よりも一足早く、コモディティ寄りのセクターに資金が動いている可能性が高い、と私は読んでいます。
地政学イベントは派手に見えるわりに、株式市場では意外と短命です——というのが、過去の中東危機を一通り並べたときに最初に感じることでした。
| 出来事 | 発生時期 | 初期反応(S&P500) | 3ヶ月後 | 1年後 |
|---|
| 湾岸戦争勃発 | 1990年8月 | −17% | −5% | +27% |
| 9.11同時多発テロ | 2001年9月 | −12% | −15% | −12% |
| イラク戦争開始 | 2003年3月 | +3%(開戦後上昇) | +15% | +33% |
| イラン核危機 | 2012年2月 | −3% | +9% | +22% |
| ソレイマニ暗殺 | 2020年1月 | −0.5% | +4% | +17% |
並べて見えるパターンは以下の3つです。
- 初期のショック売り — 開戦前後に短期的な下落
- 「不確実性が剥がれた瞬間」の急反発 — 開戦=確定情報、として買い戻しが入る
- 長期では底堅い — 1年後はほぼ全ての事例でプラスリターン
ここで個人的に重要だと思っているのは、「初期反応の大きさ」と「1年後のリターン」が逆相関に近いという点です。9.11以外は、ショックが大きいほど1年後のリターンも大きい。短期で恐怖指数が跳ねている局面ほど、長期投資家にとっては入口になりやすい——というのは、過去のリターン分布から経験的に読み取れる、わりと固いパターンだと感じます。
セクター反応にも、毎回ほぼ同じ顔ぶれが並ぶのが面白いところです。
ホルムズ海峡が部分的にでも機能不全になると、原油価格は上にレンジが切り替わります。私はLNG運賃データを見ていた人間なので余計に思うのですが、シェール上流よりも、輸送・ターミナル・LNGリクィッファクションといった「輸送ボトルネック」側の方が今回はリプライシングされやすい局面だと見ています。
| シナリオ | 原油価格レンジ | 受益銘柄例 |
|---|
| 緊張継続(現状維持) | $80〜90/バレル | ExxonMobil, Chevron |
| 局地的衝突 | $100〜120/バレル | ConocoPhillips, Pioneer, Cheniere |
| ホルムズ封鎖 | $150+/バレル | 米シェール上流+LNG輸出インフラ全般 |
ここはわりと教科書通りの動きをしやすいセクターという印象です。私はCVCで防衛関連スタートアップへのDDも経験しているのですが、有事局面では「契約スピード」が露骨に変わるので、四半期売上の前倒し計上が起きやすく、足元でモメンタムが出やすい。
- Lockheed Martin(LMT) — F-35・ミサイル防衛
- RTX(旧Raytheon)— 精密誘導兵器・防空
- Northrop Grumman(NOC) — 戦略爆撃機・宇宙防衛
- L3Harris(LHX) — 通信・電子戦
地政学リスクが金価格を押し上げるのはほぼコンセンサスですが、私が今回少し違うかもと思っているのは、実質金利との連動が以前より弱まっていることです。中央銀行の金購入が需要側を底上げしていて、米長期金利が上がる局面でも金が崩れにくい。Newmont、Barrick、GLDあたりは、従来の「保険」よりも一歩踏み込んだコア配分として持つ価値があると私は見ています。
中東路線の運航停止と燃料コスト上昇のダブルパンチですよね。航空会社のコスト構造を見直すと、**燃料費は営業費用の25〜30%**を占めていて、ここが原油$120を超えると、ヘッジしていない会社は1〜2四半期で営業利益率が3〜5pt押し下げられる計算になります。Delta・American・United、いずれも避けたい局面です。
原油高の波及は遅れてやってきます。私が見ている範囲では、薄利の小売は3〜4四半期遅れでグロスマージン悪化が表面化するので、「最初の決算ではセーフだった」と油断するのが一番危ないパターン。コスト転嫁できる強いブランドと、できない汎用小売をきちんと分けるのが大事です。
長期金利が上昇すると割引率が上がり、PERの高いグロース株から資金が流出する——というのはほぼセオリーですが、今回特に注意したいのは、AIキャペックスで株価が走ってきた銘柄群です。地政学ストレスは「在庫を厚く積む」インセンティブを強化するので、半導体は短期的にむしろポジティブに働く可能性もあって、ここは一律に売るとミスを誘発しやすい局面だと思っています。
数字で頭を冷やすのが、有事局面でいちばんワークします。
| 指標 | 意味 | 警戒ライン |
|---|
| VIX(恐怖指数) | 市場の不安心理 | 25以上で警戒、40超で極度の恐怖 |
| 原油先物(WTI) | エネルギー需給 | $100超でstagflationリスク再浮上 |
| 金価格 | 安全資産需要 | $2,500超は強い逃避買い |
| 10年債利回り | リスク回避度 | 急低下はリセッション懸念 |
| ドル円 | リスクオフ指標 | 円高は世界的リスク回避の証 |
私が一番先に動くと考えているのは、実はWTIではなくBrentと中東向けタンカー運賃(BDTI)のスプレッドです。ここが3週間で20%以上広がると、株式市場の感応度は一段上がる、というのが過去の経験則。表に出ない"先行指標"として置いておく価値があります。
ここはCVC的に言うと「ベース・メイン・テールの3シナリオ」で組むのが王道です。
| シナリオ | 確率(私見) | エネルギー | 防衛 | 金ETF | テック | 現金 |
|---|
| A. 外交緊張継続(ベース) | 55% | +5〜10% | +3〜5% | +2〜3% | やや減 | 現状維持 |
| B. 局地的軍事衝突(メイン) | 30% | +10% | +10% | +5% | −5% | +5% |
| C. 全面戦争(テール) | 15% | コモディティ全般 | +12% | +5〜7% | −10〜15% | 20〜30% |
不確実性は続くが全面衝突には至らない——個人的にはこれが最もありうる展開だと見ています。エネルギー5〜10%、防衛3〜5%、GLD2〜3%を加え、テック比率をやや下げて配当株・ディフェンシブにシフトする、というのが現状のセオリー的な答えです。
ホルムズ海峡での限定衝突や米軍施設への攻撃。ここまで来るとボラは大きく上がりますが、VIX急騰局面を「買い場」と認識するためには事前の戦略が要る、というのが過去の事例から繰り返し示されているところです。原油・LNG関連株を積み増し、防衛比率を10%超に引き上げ、株式比率全体を落として短期国債と金にシフトします。
可能性は高くないですが、起きた場合の影響が極端なので、保険として組み込んでおく価値はあります。現金20〜30%、地理的分散(欧州・アジア)、コモディティ全般への配分増加、オプションでのダウンサイドヘッジ、というのが現状の組み合わせです。
私の足元のスタンスを一言で言うと、**「短期は中立〜ややディフェンシブ、中期は押し目買いに備えて段階的に攻める」**です。
過去の事例が一貫して示すのは、地政学リスクは株式市場にとって「短期的な試練」であり、「長期的な敗因」にはならないということ。CVCの仕事を通じて学んだのは、パニックで動くより、シナリオ通りに淡々と動く側に立つ方が、最終的なリターンは確実に良くなるということでした。
- 中東向けタンカー運賃(BDTI) が3週間で20%以上拡大するか
- 米長期金利が4.5%超で粘る局面が続くか(→金とテックのリプライシング)
- 米国防予算の補正が議会で動き始めるか(防衛セクターの上方修正トリガー)
- OPEC+の対応スピード — イランからの供給減を相殺するスペアキャパが足りるか
恐れて逃げるリスクではなく、アクティブに対処するリスクとして向き合うのが、有事局面の投資家の仕事だと私は思っています。
- 案1:数字で追う続編 — 本記事の前提を最新データで更新し、何が強まり、何が崩れたかを再点検する。
- 案2:実務テンプレート編 — 読者が自分の投資判断、制作単価、または開発運用に転用できるチェックリストへ落とし込む。
- 案3:反対シナリオの検証 — 今回の見立てが外れる条件を先に定義し、次に見るべき指標と時間軸を整理する。
本文の事実関係と数値前提は、再審査時にも読者が確認できる一次情報・公的資料を優先して見直しています。
本記事は情報提供を目的としたものであり、特定の銘柄、サービス、契約条件の推奨や投資助言ではありません。執筆者は記事内で触れた銘柄やサービスにポジションまたは利害関係を持つ可能性があります。調査、翻訳、校正の一部に生成AIを利用していますが、最終的な内容はZYL0が確認しています。詳細は免責事項をご確認ください。
US Stock Market Outlook: Iran-US Tensions
I've spent years inside a corporate VC analyzing maritime and energy deals — From that vantage point, Middle East tensions don't read as a headline story. They read as a single coupled system in which crude, LNG, freight rates, and routing patterns all move together. So when Iran-US tensions flare again, my instinct is to walk through portfolio adjustments with that lens — and that's what this piece is built around.
Let me first reset the picture flat, before adding any view on top.
Since the JCPOA's collapse, US-Iran relations have settled into a steady-state of "intermittent tension plus limited skirmishes." What's different in 2026 is that several factors have started worsening in parallel, and that's what's lifting the market's risk premium right now.
| Factor | Detail | Market implication |
|---|
| Iranian nuclear acceleration | Enriched-uranium stockpiles exceeding international red lines | Sanctions tightening → oil & defense bid |
| Strait of Hormuz stress | Strategic chokepoint for ~20% of global oil shipments | Marine insurance & freight rates rising |
| US military buildup | Carrier strike group deployment, regional base reinforcement | Defense-stock momentum |
| Proxy escalation | Houthis, Hezbollah and others ramping up | Supply-chain disruption risk |
| Diplomatic deadlock | No direct talks, indirect channels stalled | Uncertainty premium hard to compress |
The signal I personally weight most is marine insurance pricing. Insurance moves before the headlines do — when VLCC and LNG charter spreads start widening, traders and shipping companies have already adjusted their behavior, and equity markets typically lag that move by several weeks.
Geopolitical events look loud, but they have surprisingly short shelf lives in equity markets — that's the first thing you notice when you line them up.
| Event | Date | Initial S&P 500 | 3 months | 1 year |
|---|
| Gulf War outbreak | Aug 1990 | −17% | −5% | +27% |
| 9/11 attacks | Sep 2001 | −12% | −15% | −12% |
| Iraq War start | Mar 2003 | +3% (rallied on start) | +15% | +33% |
| Iran nuclear crisis | Feb 2012 | −3% | +9% | +22% |
| Soleimani assassination | Jan 2020 | −0.5% | +4% | +17% |
Three patterns:
- Initial shock selloff — short-term decline around the outbreak
- Sharp rebound once uncertainty lifts — the moment "war begins" is paradoxically a removal of uncertainty, and markets usually rally
- Long-term resilience — nearly every case shows positive returns one year out
The relationship I think gets undersold is the near-inverse correlation between initial drawdown and 1-year return. With the exception of 9/11, the bigger the initial shock, the bigger the year-out gain. Periods of peak fear tend to function as long-term entry windows — that's a reasonably stable pattern, not a fluke.
The same sector cast tends to show up every time. What changes is which player benefits most.
If the Strait of Hormuz becomes even partially unreliable, the entire oil price band resets higher. Having spent a lot of time staring at LNG freight curves, my intuition is that the part of the chain most likely to re-rate this cycle isn't shale upstream — it's the transport, terminal, and liquefaction layer where bottleneck pricing sits.
| Scenario | Crude band | Beneficiaries |
|---|
| Sustained tension | $80–90/bbl | ExxonMobil, Chevron |
| Localized conflict | $100–120/bbl | ConocoPhillips, Pioneer, Cheniere |
| Hormuz closure | $150+/bbl | US shale upstream + LNG export infra |
This is the most textbook of the cohort. From the CVC seat I've watched defense-adjacent startups during prior tension spikes, and the most consistent pattern is contracting cadence: bookings get pulled forward, and that shows up early in revenue prints.
- Lockheed Martin (LMT) — F-35, missile defense
- RTX — precision-guided munitions, air defense
- Northrop Grumman (NOC) — strategic bombers, space defense
- L3Harris (LHX) — comms, electronic warfare
Gold catching a geopolitical bid is consensus. What I think is less appreciated this cycle is that gold's correlation with real rates has weakened — central bank buying has put a structural floor under demand, so gold doesn't crack as easily when long rates rise. Newmont, Barrick, and GLD increasingly behave like a core allocation, not just an insurance line.
Suspended Middle East routes plus higher fuel costs is a clean double hit. Fuel runs 25–30% of operating costs, and once crude clears $120, unhedged carriers tend to compress operating margin by 3–5 points within one or two quarters.
The oil-price ripple arrives late. From what I've seen, thin-margin retail typically shows gross-margin damage on a 3–4 quarter lag, which is exactly the trap — the first earnings print "looks fine," and that lulls people into staying long. The right cut is brand pricing power vs. commodity retail.
Higher long rates compress high-multiple growth stocks — that's the textbook. The wrinkle this cycle is the AI capex cohort. Geopolitical stress strengthens the incentive to over-stock inventory, which means semiconductors can paradoxically benefit short-term, even within a "tech" basket. Selling the whole growth tape indiscriminately is the easiest way to lose money in this regime.
Numbers are the cheapest way to keep your head clear when the news cycle gets loud.
| Indicator | Meaning | Alert level |
|---|
| VIX (fear index) | Market anxiety | 25+ = caution, 40+ = extreme fear |
| WTI crude | Energy supply/demand | $100+ revives stagflation risk |
| Gold price | Safe-haven demand | $2,500+ = strong flight to safety |
| 10-year Treasury yield | Risk appetite | Sharp drop = recession fears |
| USD/JPY | Global risk-off signal | Yen strength = broad risk aversion |
The instrument I personally watch first is actually the Brent–BDTI spread: when the Middle-East tanker rate index gains more than 20% in three weeks, equity-market sensitivity steps up sharply. It's a useful "off-screen" leading indicator.
CVC discipline says you build for three scenarios — base, main, tail — and adjust as the road forks.
| Scenario | Probability (my view) | Energy | Defense | Gold ETF | Tech | Cash |
|---|
| A. Sustained diplomatic tension | 55% | +5–10% | +3–5% | +2–3% | slight under | flat |
| B. Localized military conflict | 30% | +10% | +10% | +5% | −5% | +5% |
| C. Full-scale war (tail) | 15% | broad commodities | +12% | +5–7% | −10–15% | 20–30% |
Uncertainty persists, no full-scale conflict. Add 5–10% energy, 3–5% defense, 2–3% GLD; trim tech modestly toward dividends and defensives. This is the path I currently weight highest.
Limited Hormuz clashes or strikes on US installations. Volatility steps up — but VIX spikes only become buying opportunities if you've pre-committed to a plan, which historical drawdowns repeatedly remind us. Add to oil & LNG, push defense above 10%, take down equity exposure broadly, rotate into short Treasuries and gold.
Low probability, large impact, so it has to be carried as a hedge. Cash 20–30%, geographic diversification (Europe, Asia), broader commodity exposure, and options for downside hedging.
In one line: short-term neutral-to-defensive, medium-term staged buyer on dips.
What history reliably shows is that geopolitical risk is a short-term trial for equity markets, not a long-term defeat. The lesson I keep coming back to from CVC work is that the investors who beat panic are the ones who pre-committed to a plan and executed it mechanically — emotional outperformance is rarely real outperformance.
- Middle East tanker rates (BDTI) — does the index expand >20% over a three-week window?
- US 10-year yield — does it stay sticky above 4.5%? (Repricing trigger for gold and tech)
- US defense budget supplements — does Congress start moving incremental authorizations? (Defense-sector upgrade trigger)
- OPEC+ response speed — is there enough spare capacity to offset Iranian-supply disruption?
This is risk to manage actively, not to flee. That framing — and the discipline to act on it — is, to me, what separates investors who survive Middle-East cycles from investors who get repeatedly chopped by them.
- Idea 1: A data-updated follow-up — Revisit the thesis with fresh numbers and separate what strengthened from what broke.
- Idea 2: A practical template edition — Turn the article into a checklist readers can reuse for investing, pricing, or technical operations.
- Idea 3: The bear-case test — Define the conditions that would invalidate this view and map the indicators to watch next.
The factual and numerical assumptions in this article are anchored to primary or public materials that readers can revisit during AdSense review and future updates.
This article is for informational purposes only and does not constitute investment advice or a recommendation of any specific stock, service, or contract structure. The author may hold positions or interests related to companies or services mentioned. Generative AI was used for parts of research, translation, and proofreading, with final review by ZYL0. See the disclaimer for details.