株式市場の過熱感を測る:バフェット指数・CAPE・ERP・集中度で読む2026年6月の温度計
私は未上場のバリュエーションと日々格闘するのが仕事です。だからこそ、指数全体に走る「価格と実態の乖離」は他人事に思えません。本稿を書こうと思った直接のきっかけは、ウォーレン・バフェット本人が率いてきたBerkshire Hathawayの現金が、2026年Q1に過去最高の3,974億ドルまで積み上がったという事実でした。指標を100個並べるより、これ一つのほうが雄弁かもしれない、と。
最初に立場を明らかにします。本稿の見立ては警戒・弱気寄りです。ただし「明日暴落する」と言いたいのではない。バリュエーションは歴史的極値、益利回りは国債に並ばれ、レバレッジは記録的——にもかかわらず指数は最高値圏にある。この状態は、リスク・リワードが上方向に薄く下方向に厚い、つまり非対称だと私には見えます。あくまで2026年6月時点の温度計です。
最初の所感を述べると、いま驚くべきは「数字が高い」ことではなく、「複数の物差しが同時に振り切れている」ことです。
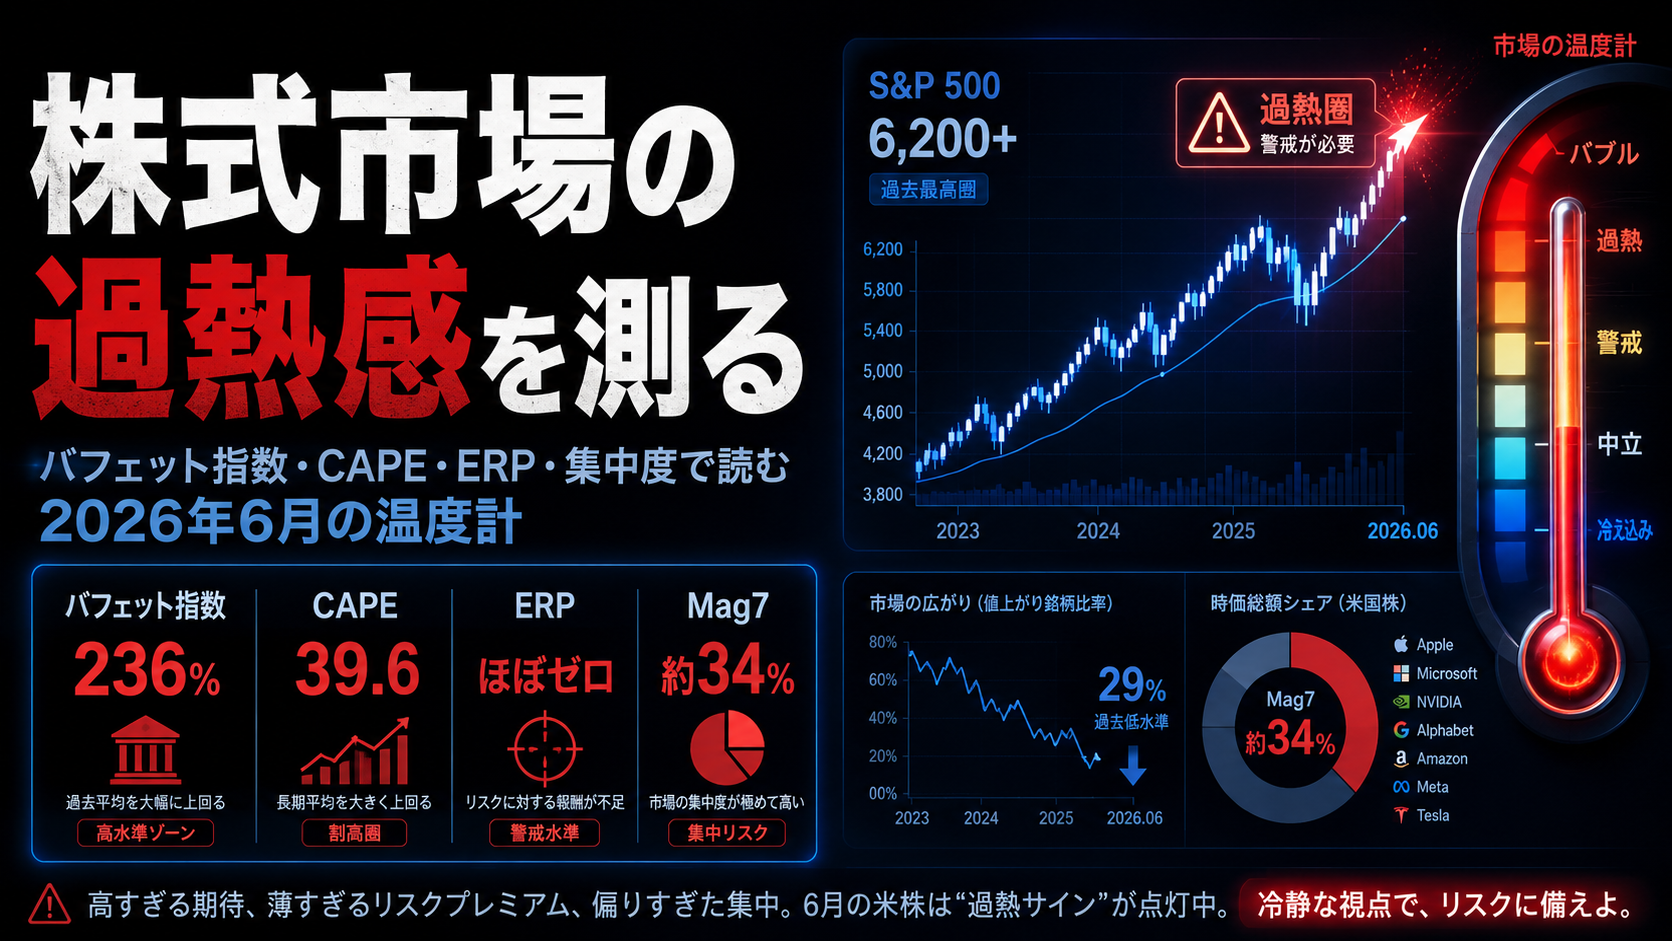
事実関係から。米国のバフェット指数(株式時価総額÷GDP)は2026年6月時点で約236%。歴史平均の約165%を43%上回り、記録のあるレンジ(約33%〜238%)のほぼ上限に貼り付いています。これは史上ほぼ最高、第2位の水準で、上回るのは直前の四半期だけ。元祖バフェット指数の解釈では「著しい割高」です。
同じ向きをShiller CAPE(景気循環調整後PER)も指しています。2026年6月で約39.6。過去最高の44.2に迫り、長期トレンドを約77%上回る。1870年代以来でこの高さに達したのは、ドットコム期と直近だけです。私が引っかかるのは、二つの全く異なる設計の指標——時価総額対GDPと、10年平均利益対株価——が、同じ「極値」を指している点です。片方だけなら測り方の癖を疑えますが、両方が振り切れると、言い訳が効かなくなる。
そして象徴的なのがBerkshireの現金です。3,974億ドルのうち現金同等物は約520億ドルで、残りの大半は短期国債。同社は2022年10月から2025年3月まで10四半期連続で株式をネット売り越し、純額で1,740億ドル超を放出しました。Appleはほぼ50%から約22%へ、Bank of Americaも半減超。「買うものがない」という行動そのものが、指数バリュエーションへの最も率直なコメントだと私は受け取っています。
| 指標 | 2026年6月の値 | 歴史的な目安 | 私の評価 |
|---|
| バフェット指数 | 約236% | 平均約165% | 史上ほぼ最高、第2位 |
| Shiller CAPE | 約39.6 | 中央値約16/最高44.2 | ドットコム級の第2ピーク |
| Berkshire現金 | 3,974億ドル | 前ピーク3,817億ドル | 「買い場なし」の行動証言 |
数字を一つに束ねる前に、念のため断っておきます。これらは「いつ下がるか」を当てる道具ではありません。割高は何年も割高のまま続きうる。私が見ているのは確率と非対称性であって、タイミングではありません。
二つ目の所感。単一指標は必ず弱点を持つので、私はいつも「バリュエーション」と「センチメント・需給」の二系統を並べて温度を測ります。
まずバリュエーション系。ここで一番効くのはERP(株式リスクプレミアム)です。S&P500の益利回りは2026年6月で約4.0%、10年国債利回りは約4.3〜4.6%。つまり株式を持っても、益利回りベースで国債を上回る上乗せがほぼ消えている。ERPがゼロ近傍まで縮むのは、ドットコム崩壊以来です。「リスクを取る見返り」が薄いのに最高値、という構図がここに集約されています。
| バリュエーション指標 | 2026年6月の値 | 含意 | 私の注目点 |
|---|
| バフェット指数 | 約236% | 著しい割高 | GDP比で過去最大級 |
| Shiller CAPE | 約39.6 | 将来リターン抑制 | 長期トレンド+77% |
| S&P500 予想PER | 約22倍 | 高め | 益利回り換算4%台 |
| ERP(益利回り−10年債) | ほぼゼロ | リスク対価の消失 | ドットコム以来の低さ |
| Mag7の時価総額シェア | 約34% | 集中リスク | 利益シェアは約31% |
集中度には一言補足が要ります。S&P500の上位10社が時価総額の約38%を占める一方、利益のシェアは約31%。つまり指数の値段は、一握りの銘柄の「将来期待」に上乗せして払われている。Mag7の予想PERは約31倍で、残り493社の約20倍を大きく超える。指数を買うことは、実質的にこの数社の高倍率を買うことに近い、というのが私の整理です。
次にセンチメント・需給系。ここで意外なねじれが出ます。2026年6月26日時点で、CNN Fear & Greed指数は23(Extreme Fear=極端な恐怖)、VIXは18.89。つまり構造的バリュエーションは極値なのに、短期心理はむしろ恐怖に振れている。同日、日経平均は4.15%下落しました。私の読みでは、これは「過熱がいかに脆いか」の予行演習です。
| センチメント・需給指標 | 2026年6月の値 | 含意 | 私の注目点 |
|---|
| CNN Fear & Greed | 23(極端な恐怖) | 短期心理は急冷 | 急落直後の典型 |
| VIX | 18.89 | パニックではない | 20割れで小康 |
| 信用買い残(FINRA) | 過去最高 約1.42兆ドル | レバレッジ最大 | 前年比+53.7% |
| 純信用残高 | 過去最低 約-9,917億ドル | 手元現金より借入が多い | 巻き戻しの火種 |
この二表を重ねると、私の違和感が言語化できます。バリュエーションは天井、レバレッジは記録的、なのに心理はすでに恐怖側。普通、天井では強欲が支配します。今回は強欲(記録的な信用買い)と恐怖(F&G 23)が同居している。これは「過熱が頂点を打ち、冷え始める初期局面」でよく見る組み合わせだと、私には見えます。
三つ目の所感。米国だけ見ると視野が狭くなるので、日本を鏡にして相対的な割高・割安を測ります。
日本のバフェット指数は約254%で、実は米国(236%)より高く、20年来の最高水準。ところが益回りの物差しに切り替えると景色が変わります。Nikkei225は2026年初時点で予想PER約16.9倍、CAPE約29.4。S&P500の予想PER約22倍、CAPE約39.6に比べると、明確に安い。バフェット指数が日本で高く出るのは、日本企業の海外稼得が大きく時価総額/GDPを押し上げるからで、ここは指標の癖を割り引いて読む必要があります。
| 指標 | 米国(S&P500) | 日本(Nikkei225) | 私の解釈 |
|---|
| バフェット指数 | 約236% | 約254% | 日本は海外稼得で過大に出る |
| 予想PER | 約22倍 | 約16.9倍 | 益回りでは日本が割安 |
| CAPE | 約39.6 | 約29.4 | 過熱は米国がより深刻 |
| 直近の値動き(6/26) | 軟調 | 日経-4.15% | 米株過熱の余波に同調 |
ここから防御の型に落とします。私はDDで、良い案件でも高すぎる価格には数字で反対してきました。同じ規律を指数にも当てます。狙いは「当てる」ことではなく、非対称なリスクで損なわれにくくすること。具体策を一枚に。
| 防御の型 | 具体手段(例) | 狙い | 私の留意点 |
|---|
| 現金比率を上げる | T-bill、BIL、SGOV | 下落時の買い余力+利回り確保 | バフェットと同じ発想 |
| テールヘッジ | SPX/SPYプットスプレッド | 暴落時の保険 | VIXコールは時間減価に注意 |
| 集中度を薄める | 均等加重(RSP)へ分散 | Mag7依存の低減 | 上昇相場では出遅れ得る |
| ディフェンシブ/バリュー | XLP、XLV、XLU、BRK.B | 景気・金利耐性 | 割高相場では相対防御 |
| 実物・無相関 | 金(GLD) | ERP消失局面の分散 | 短期は金利と逆相関 |
誤解なきように言えば、これは「全部売って現金にしろ」という話ではありません。私が避けたいのは、ERPがゼロの相場で、集中度リスクを丸ごと抱えたまま満額ロングし続けることです。保険のコストを払ってでも、下方向の厚さを薄くしておく——それが非対称な局面での合理だと考えます。
四つ目の所感。最後に、ここまでの指標がどのシナリオで効くかを紐づけ、明確なコールで締めます。確率は私の主観です。
| シナリオ | 確率(主観) | 内容 | 指標への含意 |
|---|
| ベース | 45% | 高値もみ合い、ボラ上昇、循環物色 | 過熱は維持、ERPは薄いまま |
| ソフト調整 | 30% | 10〜20%の健全な調整で過熱一部解消 | CAPE・バフェット指数が一段低下 |
| 強気継続 | 15% | AI収益が期待を追認、益成長で倍率正当化 | 高倍率が一部追認される |
| テール | 10% | レバレッジ巻き戻し+集中度崩れで急落 | Mag7調整が指数を直撃 |
私の投資コールは明確です。短期(〜3ヶ月)はやや警戒、中期(6〜18ヶ月)はニュートラル〜慎重。バリュエーションは極値、ERPはほぼゼロ、信用買い残は記録的——この三点が揃う相場で、私はリスクを満額では取りません。ただし直近の急落とExtreme Fearは短期反発も生むので、新規の積極ショートにも慎重です。やることは派手な逆張りではなく、現金比率を上げ、テールヘッジを薄く持ち、集中度を均すという地味な調整です。
最後にウォッチポイントで締めます。これらが動いたら、私は見立てを更新します。
- ERPがマイナス深化、または10年債が4.7%超:株式の相対的魅力がさらに低下し、調整の引き金になりやすい。
- 信用買い残が減少へ転換:レバレッジ巻き戻しの初動。テールシナリオの確度が上がる。
- VIXが20超で定着+F&Gが回復しない:短期心理の悪化が一過性でなくなる兆候。
- Mag7のAI設備投資の回収進捗:高倍率を正当化できるか否かの本丸。決算ガイダンスを最優先で見る。
- バフェット指数が225%割れ:過熱の最初の冷却サイン。逆に240%超なら非対称はさらに悪化。
繰り返しますが、これは2026年6月時点の温度計です。割高は続きうるし、私の確率も外れうる。それでも、リスク・リワードが非対称なときに満額で乗らないのは、CVCの現場で私が学んだ最も地味で効く規律です。半年後に、この温度計を答え合わせします。
次号の記事案
- 案1:ERPゼロ相場のポートフォリオ設計|現金・ヘッジ・株式の最適配分を主観確率で組む — 本稿の防御の型を一歩進め、ERPがゼロ近傍の局面で「現金比率を何%まで上げるか」をシナリオ確率から逆算する。
- 案2:Mag7集中度の解剖|指数を買うとは、この数社の31倍を買うこと — 上位10社の利益シェアと時価シェアの乖離を分解し、集中度が崩れたとき指数がどれだけ動くかを感応度で定量化する。
- 案3:日米バリュエーション・ギャップの収束シナリオ|割安な日本株は本当に逃げ場か — バフェット指数とPERのねじれを起点に、米株調整時に日本株がディフェンシブに効くかをデータで検証する。
本文の数値は、再審査時にも読者が確認できる一次情報・公的資料を優先して見直しています(2026年6月時点)。指標値は出典・更新日により小幅に異なります。本稿の確率・配分は筆者の主観に基づく見立てであり、将来を保証しません。
本記事は情報提供を目的としたものであり、特定の銘柄、ETF、投資戦略の推奨や投資助言ではありません。記事中の確率・配分・シナリオは筆者の前提に基づく見立てであり、将来の結果を保証しません。執筆者は記事内で触れた銘柄やサービスにポジションまたは利害関係を持つ可能性があります。調査、翻訳、校正の一部に生成AIを利用していますが、最終的な内容はZYL0が確認しています。詳細は免責事項をご確認ください。
Measuring Stock-Market Froth: Reading June 2026 Through the Buffett Indicator, CAPE, ERP, and Concentration
My day job is wrestling with private-company valuations. That is exactly why a market-wide gap between price and fundamentals never feels like someone else's problem. The direct trigger for this piece was a single fact: Berkshire Hathaway — the firm Warren Buffett built — ended Q1 2026 with a record $397.4 billion in cash. Sometimes one number is more eloquent than a hundred indicators.
Let me state my stance up front: this read is cautious and bearish-leaning. I am not saying "it crashes tomorrow." Valuations are at historic extremes, the earnings yield has been caught by Treasuries, and leverage is at a record — yet the index sits near its highs. To me, that makes the risk/reward asymmetric: thin on the upside, thick on the downside. This is a June 2026 thermometer, nothing more.
My first observation: what is striking now is not that one number is high, but that several different rulers are pinned at once.
Start with the facts. The US Buffett Indicator (total market cap ÷ GDP) sits at about 236% as of June 2026. That is 43% above its historical average of roughly 165% and glued to the top of its recorded range (about 33%–238%). It is the second-highest reading in history, exceeded only by the prior quarter. On the original interpretation, that is "significantly overvalued."
The Shiller CAPE (cyclically adjusted P/E) points the same way — about 39.6 in June 2026, closing in on the all-time high of 44.2 and roughly 77% above its long-term trend. Outside the dot-com era and right now, the ratio has not reached this height since the 1870s. What nags at me is that two rulers of entirely different design — market cap to GDP, and ten-year average earnings to price — point at the same extreme. If only one were stretched, I could blame its quirks. When both are pinned, the excuses run out.
Berkshire's cash is the symbol of it. Of the $397.4 billion, about $52 billion is cash equivalents and most of the rest sits in Treasury bills. The firm was a net seller of equities for ten straight quarters from October 2022 to March 2025, shedding over $174 billion net. Apple fell from nearly 50% of the equity book to about 22%; Bank of America was cut by more than half. The behavior itself — "nothing worth buying" — is, to me, the most candid comment anyone has made on index valuation.
| Indicator | June 2026 reading | Historical gauge | My read |
|---|
| Buffett Indicator | ~236% | Avg ~165% | Near all-time high, #2 |
| Shiller CAPE | ~39.6 | Median ~16 / high 44.2 | Dot-com-grade second peak |
| Berkshire cash | $397.4B | Prior peak $381.7B | A "no entry point" testimony |
Before I bundle these, one caveat. These are not timing tools for "when it drops." Expensive can stay expensive for years. What I watch is probability and asymmetry, not the calendar.
A second observation. Every single indicator has a blind spot, so I always read the temperature on two tracks — "valuation" and "sentiment/positioning."
Valuation first. The one that bites hardest here is the ERP (equity risk premium). The S&P 500 earnings yield is about 4.0% in June 2026, against a 10-year Treasury yield of roughly 4.3–4.6%. In other words, the earnings-yield premium for holding stocks over bonds has nearly vanished. An ERP compressed toward zero is something we have not seen since the dot-com bust. "Thin reward for risk, yet record highs" — that contradiction concentrates right here.
| Valuation indicator | June 2026 reading | Implication | What I watch |
|---|
| Buffett Indicator | ~236% | Significantly overvalued | Among the largest vs. GDP ever |
| Shiller CAPE | ~39.6 | Suppressed future returns | +77% above long-term trend |
| S&P 500 forward P/E | ~22× | Elevated | ~4% earnings yield |
| ERP (earnings yield − 10Y) | ~zero | Risk reward gone | Lowest since dot-com |
| Mag 7 market-cap share | ~34% | Concentration risk | Earnings share only ~31% |
Concentration needs one note. The top 10 names hold about 38% of market cap but only ~31% of earnings. So the index's price is paid with a markup on the "future expectations" of a handful of stocks. The Mag 7 trade at ~31× forward, far above the other 493 at ~20×. Buying the index is, in effect, close to buying that small group's high multiple.
Now sentiment and positioning, where a surprising torsion shows up. As of June 26, 2026, the CNN Fear & Greed Index reads 23 (Extreme Fear) and the VIX is 18.89. So structural valuation is at an extreme while short-term psychology has swung to fear. The same day, the Nikkei fell 4.15%. My read: this is a dress rehearsal for how fragile the froth is.
| Sentiment / positioning indicator | June 2026 reading | Implication | What I watch |
|---|
| CNN Fear & Greed | 23 (Extreme Fear) | Psychology cooled fast | Classic post-drop print |
| VIX | 18.89 | Not panic | A lull below 20 |
| Margin debt (FINRA) | Record ~$1.42T | Leverage maxed | +53.7% year over year |
| Net credit balance | Record ~−$991.7B | Borrowing exceeds cash | Kindling for a unwind |
Overlay the two tables and my unease becomes sayable. Valuation at the ceiling, leverage at a record — yet psychology already on the fear side. Normally, greed rules at tops. This time, greed (record margin debt) and fear (F&G at 23) coexist. To me, that combination is the kind you often see in the early phase where froth has crested and begun to cool.
A third observation. Looking only at the US narrows the field, so I use Japan as a mirror to gauge relative cheapness and richness.
Japan's Buffett Indicator is about 254% — actually higher than the US (236%) and a 20-year peak. But switch to an earnings ruler and the picture flips. The Nikkei 225 trades at a forward P/E of ~16.9× and a CAPE of ~29.4 (early 2026), clearly cheaper than the S&P 500's ~22× forward and ~39.6 CAPE. The Buffett Indicator runs high in Japan because Japanese firms' large overseas earnings inflate market cap relative to domestic GDP — a quirk to discount when reading it.
| Indicator | US (S&P 500) | Japan (Nikkei 225) | My interpretation |
|---|
| Buffett Indicator | ~236% | ~254% | Japan overstated by overseas earnings |
| Forward P/E | ~22× | ~16.9× | Japan cheaper on yield |
| CAPE | ~39.6 | ~29.4 | Froth deeper in the US |
| Recent move (6/26) | Soft | Nikkei −4.15% | Synced to US-froth aftershock |
From here I move to defensive forms. In diligence, I have opposed too-high prices with numbers even on good deals. I apply the same discipline to the index. The goal is not to "call it" but to be harder to damage under asymmetric risk. Here is the playbook on one page.
| Defensive form | Concrete tools (examples) | Purpose | My caveat |
|---|
| Raise cash | T-bills, BIL, SGOV | Dry powder + yield | The Buffett move |
| Tail hedge | SPX / SPY put spreads | Crash insurance | Mind VIX-call time decay |
| Thin concentration | Shift to equal weight (RSP) | Less Mag 7 dependence | May lag in a rally |
| Defensive / value | XLP, XLV, XLU, BRK.B | Cycle / rate resilience | Relative defense when rich |
| Real / uncorrelated | Gold (GLD) | Diversify a zero-ERP regime | Inverse to rates short-term |
To be clear, this is not "sell everything and go to cash." What I want to avoid is staying fully long, carrying the whole concentration risk, in a market where the ERP is zero. Paying the cost of insurance to thin the downside — that, to me, is the rational stance in an asymmetric setup.
A fourth observation. Finally, I tie the indicators above to the scenario where each works, and close with an explicit call. The probabilities are my own.
| Scenario | Probability (subjective) | Story | Indicator implication |
|---|
| Base | 45% | High-level chop, rising vol, rotation | Froth persists, ERP stays thin |
| Soft correction | 30% | A healthy 10–20% pullback resets some froth | CAPE / Buffett Indicator step down |
| Bull continuation | 15% | AI earnings ratify hopes; growth justifies multiples | High multiples partly validated |
| Tail | 10% | Leverage unwind + concentration break → sharp drop | A Mag 7 correction hits the index directly |
My investment call is explicit. Near-term (next 3 months) cautious; medium-term (6–18 months) neutral-to-careful. When valuations are at an extreme, the ERP is near zero, and margin debt is at a record all at once, I do not take risk at full size. But the recent drop and Extreme Fear can also spark a near-term bounce, so I am equally wary of fresh aggressive shorts. The move is not a flashy contrarian bet but a plain adjustment: raise cash, hold a thin tail hedge, and even out concentration.
I close on watch points. If these move, I update the view.
- ERP turning more negative, or the 10Y above 4.7%: equities lose more relative appeal — a likely trigger for a correction.
- Margin debt turning down: the opening move of a leverage unwind; the tail scenario gains odds.
- VIX holding above 20 while F&G fails to recover: a sign the psychology shift is not transient.
- Mag 7's progress on AI capex payback: the heart of whether high multiples can be justified — guidance is my top priority.
- Buffett Indicator below 225%: the first cooling sign; conversely, above 240% the asymmetry worsens further.
Again, this is a June 2026 thermometer. Expensive can persist, and my probabilities can be wrong. Even so, not riding at full size when risk/reward is asymmetric is the plainest, most effective discipline I learned on the CVC floor. I will mark this thermometer to market in six months.
Next Issue Ideas
- Idea 1: Portfolio Design for a Zero-ERP Market — Sizing Cash, Hedges, and Equity by Subjective Probability — Push this post's defensive playbook a step further and back out "how high to raise cash" from scenario probabilities when the ERP sits near zero.
- Idea 2: Dissecting Mag 7 Concentration — Buying the Index Means Buying This Group's 31× — Decompose the gap between the top 10's earnings share and market-cap share, and quantify by sensitivity how far the index moves if concentration breaks.
- Idea 3: Convergence Scenarios for the US–Japan Valuation Gap — Is Cheaper Japan Really a Haven? — Starting from the Buffett-Indicator-vs-P/E torsion, test with data whether Japanese equities act defensively during a US correction.
The figures here are anchored to primary or public sources that readers can revisit during review and future updates (as of June 2026). Indicator values vary slightly by source and update date. The probabilities and allocations are the author's subjective view and do not guarantee the future.
This article is for informational purposes only and does not constitute investment advice or a recommendation of any specific stock, ETF, or strategy. The probabilities, allocations, and scenarios are the author's assumption-based view and do not guarantee future results. The author may hold positions or interests related to companies or services mentioned. Generative AI was used for parts of research, translation, and proofreading, with final review by ZYL0. See the disclaimer for details.