強い雇用が株を下げる理由:予想の3倍という数字を割引率で読み直す
ウォーシュ・ショックの前編と後編を書き終えたのが9月4日の朝だった。その日の夜に、答え合わせの材料が想像よりずっと早く出てきた。8月の米雇用統計である。数字を見た瞬間に「これは株が下がる」と思い、実際に下がった。
ただ、なぜ下がるのかを人に説明しようとすると、意外なほど言葉に詰まる。景気が強いのに株が下がる。この一文は、投資を始めて日が浅い人にはほぼ確実に引っかかるし、正直に言えば私も昔ここで一度つまずいた。今回はその引っかかりを、割引率という一本の配管に絞って解きほぐしてみたい。
まず着地した数字を並べる。
| 項目 | 市場予想 | 実績 | 備考 |
|---|
| 非農業部門雇用者数 | +5.3万人 | +16.2万人 | 3月以来の大きさ |
| 失業率 | 4.1% | 4.1% | 予想通り横ばい |
| 6月・7月の改定 | ― | 合計 +5.5万人 | 7月の減少が帳消しに |
| 飲食サービス | ― | +5.9万人 | 増加の主因 |
| 地方政府(教育) | ― | +4.2万人 | 増加の主因 |
| 情報産業 | ― | 減少 | AI関連の人員削減観測と整合的 |
予想+5.3万人に対して実績+16.2万人。約3倍である。しかも6月・7月の改定が合計+5.5万人の上振れで、7月にいったん「雇用が減った」とされていた事実そのものが書き換えられた。労働市場が減速しているという直近数か月の物語が、一夜でひっくり返った格好だ。
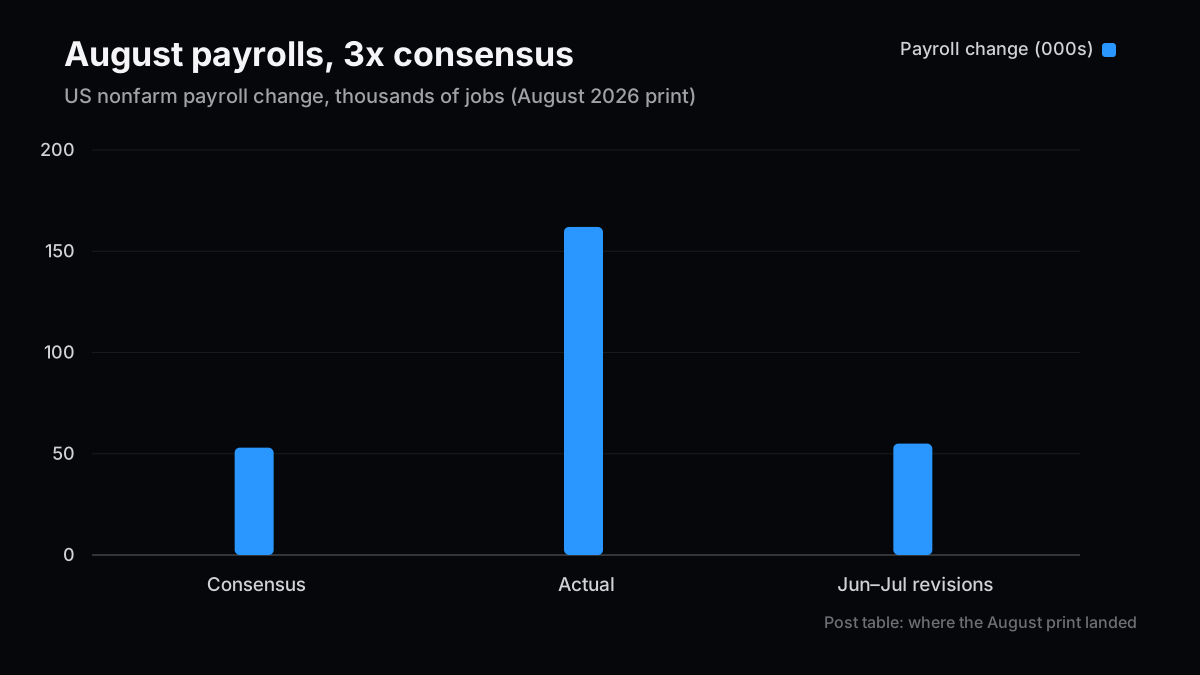
私がこの統計で最初に目を留めたのは、実は総数ではなく内訳のほうだった。増加を牽引したのが飲食サービスと地方政府の教育部門で、その一方で情報産業は人を減らしている。つまり「AIが効いている産業では雇用が減り、AIが効きにくい対人サービスで雇用が増えた」という構図になっている。強い数字の中身が、必ずしもテック景気の強さを意味していない。ここは後で効いてくるので覚えておきたい。
そして市場の反応が、直感に反する方向に出た。
| 指標 | 9月4日の動き | 水準・備考 |
|---|
| S&P 500 | -0.38% | 7,718.60で引け |
| NASDAQ総合 | -0.29% | 26,506.99で引け |
| ダウ工業株30種 | -0.51% | 260ドル超の下落 |
| 米2年債利回り | 上昇 | 2025年1月以来の高水準 |
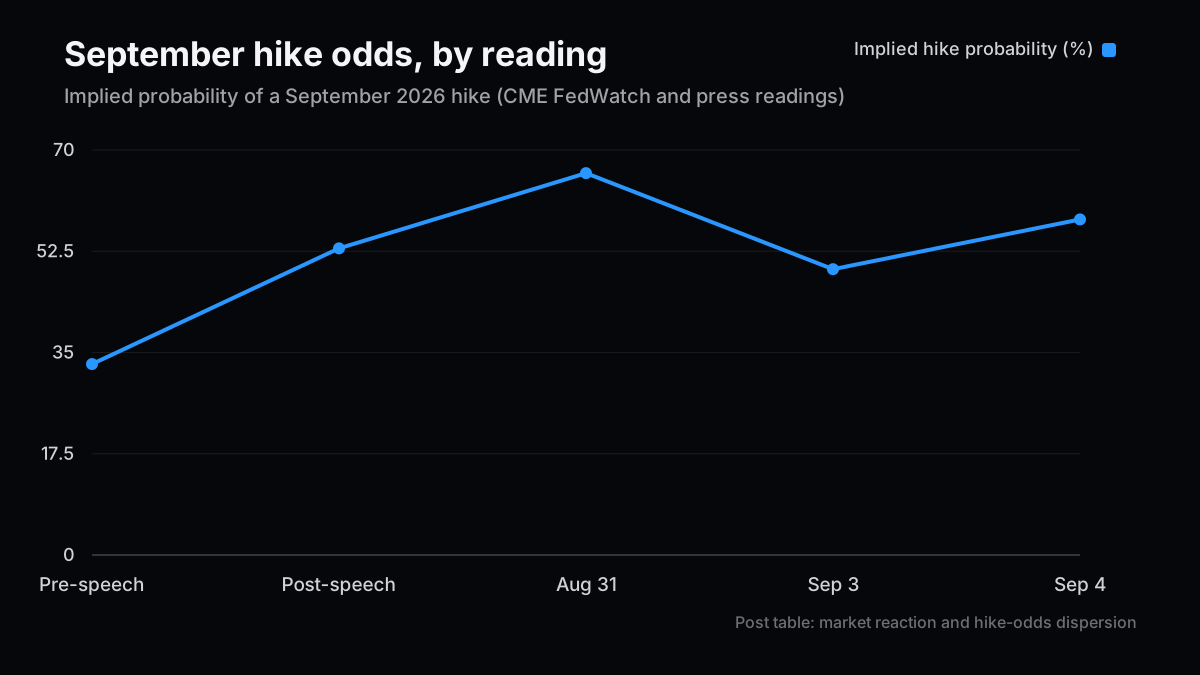
| 9月利上げ織り込み | 49.4% → 58% | CME FedWatch、前日比 |
景気が強い。雇用が増えた。それなのに主要3指数は揃って下げ、下落率がもっとも大きかったのはハイテク偏重のNASDAQではなくダウだった。この最後の一点は後で触れる。
ここからが本題だ。「Good news is bad news」という言い回しは市場で使い古されているが、標語として覚えても役に立たない。大事なのは、良いニュースが悪いニュースに変換される配管がどこを通っているか、である。
配管は一本しかない。割引率だ。
株価は、将来のキャッシュフローを現在価値に割り戻した合計である。分子が将来利益、分母が割引率。強い雇用統計は、この式の分子と分母の両方を動かす。
- 分子への影響:景気が強い → 企業の売上・利益見通しが上がる → 株価にプラス
- 分母への影響:景気が強い → 利上げ観測が上がる → 割引率が上がる → 株価にマイナス
9月4日に起きたのは、分母の動きが分子の動きを上回ったということに尽きる。市場は「雇用が16万人増えたことで企業利益が改善する幅」よりも「利上げ確率が49.4%から58%へ動いたことで割引率が上がる幅」のほうを大きく見積もった。
本当にそうか、と自分に問い直してみる。──いや、より正確に言えば、分子のほうは既にかなり織り込まれていた、と言うべきだろう。ウォーシュFRB議長は8月28日のジャクソンホール講演で、実体経済の強さを強調し、労働市場のリスクをむしろ軽く扱ったうえで、高インフレこそが当面の「predominant focus(最優先課題)」だと述べていた。議長が既に「景気は強い」と宣言していたのだから、雇用統計の上振れは分子にとって新情報が薄い。一方、利上げ確率にとっては決定的な追い風になる。非対称なのだ。
その非対称性は、割引率の感応度が銘柄によってまったく違うことで増幅される。
| 銘柄タイプ | キャッシュフローの重心 | 割引率+1%の理論価格インパクト | 代表例 |
|---|
| 高配当・成熟企業 | 1〜5年(手前) | 小さい | 生活必需品、公益 |
| 一般的な優良企業 | 5〜10年 | 中程度 | 大型消費財 |
| 高成長・先行投資型 | 10〜20年(遠い) | 大きい | AI設備投資、SaaS |
| 収益化前・テーマ株 | 20年以降 | きわめて大きい | 一部のAIインフラ関連 |
債券のデュレーションとまったく同じ理屈である。キャッシュフローの重心が遠いほど、割引率の変化に対する価格の弾力性が大きくなる。株式でこれを言い換えると、「今の利益で買われている銘柄」より「将来の利益で買われている銘柄」のほうが金利に弱いということになる。
ここで、さきほど保留にしたダウの下落率が最大だったという事実に戻る。素直にデュレーション理論だけで考えれば、下げが最も大きいのはNASDAQのはずだった。実際にはダウが-0.51%、NASDAQが-0.29%である。つまりこの日の下げは、純粋なデュレーション調整ではなかった。景気敏感・金融・資本財といったダウの構成銘柄が抱える、借入コスト上昇という別の経路も同時に効いている。割引率の話は強力だが、それだけで市場のすべてを説明できるわけではない。この程度の解像度は持っておきたい。
後編で示したとおり、ハイパースケーラー4社の2026年設備投資は合計約7,250億ドル、前年比+77%に達している。そして資金調達の構造がこの1年で大きく変わった。増分負債調達/資本支出比率はFY24の約9%から、2026年LTMで約32%まで上がっている。
この2つの数字を、いま議論している割引率の話に重ねると、AI設備投資銘柄が二重に金利に晒されていることが見えてくる。
| 経路 | 内容 | 効き方 |
|---|
| 割引率経路(分母) | 遠い将来の回収を前提とする投資 → デュレーションが長い | 株価バリュエーション |
| 資金調達経路(実キャッシュ) | 設備投資の約3分の1を外部負債で賄う → 金利が費用に直結 | 実際の損益・FCF |
| 需要経路(分子) | 顧客企業の設備投資意欲が金利で鈍る | 受注・売上 |
普通のグロース株が晒されているのは1本目だけだ。AI設備投資の中核にいる企業は、1本目と2本目を同時に浴びる。後編で「増分負債調達比率がFY24の9%から32%まで上がったのは相当に速い」と書いたが、その速さが意味するのは、金利上昇が株価だけでなく損益計算書そのものに入り込む余地が1年前より3倍以上に広がった、ということだ。
自社でPoC提案から数億円規模の社内決裁を取得し、実行まで持っていった経験から言うと、社内のハードルレートが数ポイント動くだけで、事業性がまったく同じプロジェクトでも決裁の通り方が変わる。「金利が上がったから止めます」と明示的に言われることはまずない。代わりに、検討期間が延び、追加の感度分析を求められ、フェーズが分割され、気づくと1年後ろにずれている。設備投資の減速は、宣言ではなく遅延として現れる。ここが数字を見るときにいちばん見落としやすいところだと思っている。
そしてもう一点、時間軸のズレがある。車載EEPROMのプロセス開発でTCADを回していた頃の感覚だが、半導体の需要シグナルが実際の生産計画に反映されるまでには、ウェハー投入からロット完了までのリードタイムだけで数四半期かかる。ハイパースケーラーが発注を絞ったとしても、それがNVIDIAやメモリメーカーの数字に出てくるのは早くて翌四半期以降だ。逆に言えば、いま決算が good に見えていることは、金利上昇が効いていないことの証明にはならない。株価はこのラグを先回りして動く。9月4日にNASDAQが下げたのは、まさにその先回りである。
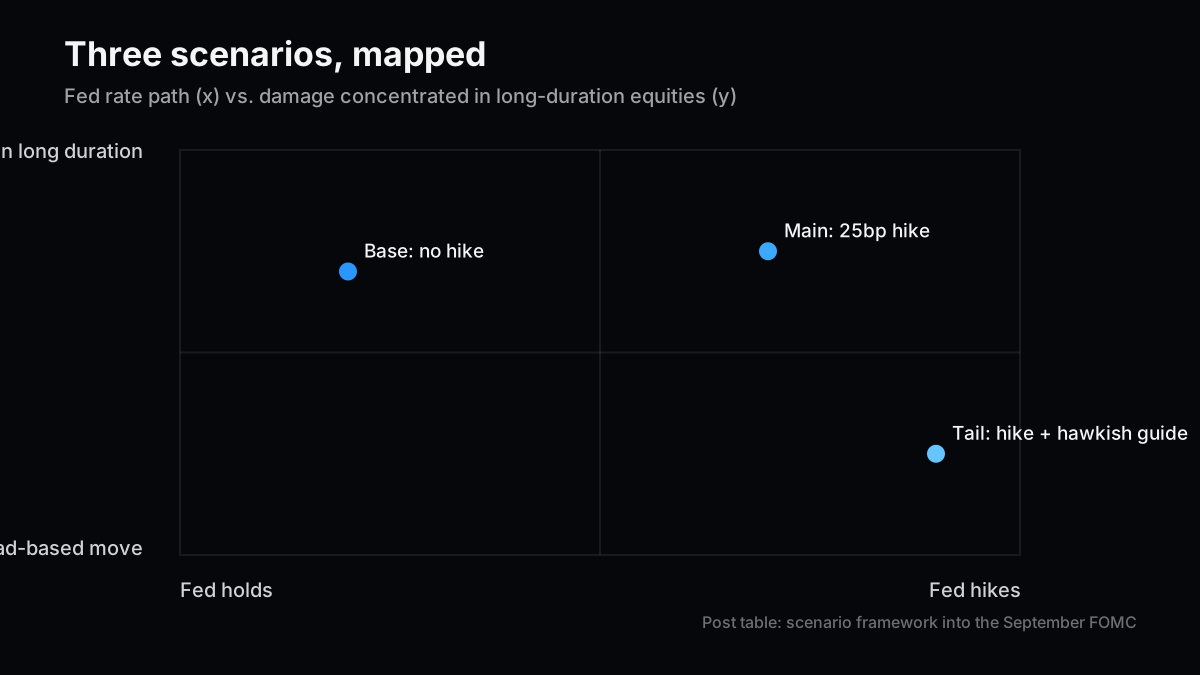
後編では、9月FOMCに向けて「メイン:一部繰延」をもっとも厚く見ると書いた。雇用統計を受けて、その見立てをどう更新するか。結論から言えば、確率配分を少しだけメイン寄りに動かすが、シナリオの骨格は変えない。
| シナリオ | 内容 | 割引率への含意 | AI設備投資銘柄への含意 |
|---|
| ベース:見送り | CPIが下振れ、FOMCは据え置き+ハト派トーン | 長期金利が低下 | デュレーション巻き戻しで大きく反発 |
| メイン:25bp利上げ | 織り込み通りに1回、その後は様子見 | 短期金利上昇、長期は限定 | 選別が進み、FCF自給率の高い銘柄が優位 |
| テール:利上げ+タカ派 | 利上げに加えて追加引き締めを示唆 | イールドカーブ全体が上方 | 資金調達経路が直撃、広範に下落 |
数字の裏側で気になっているのは、利上げ確率そのものの出どころが揃っていないことだ。CME FedWatchベースでは9月3日49.4%→9月4日58%だが、報道ベースでは52%→59%という数字も出ているし、8月31日時点では66%という集計もあった。10ポイント以上のばらつきがある。この散らばりは、単なる計測誤差ではなく、市場自身がまだ確信を持てていないことの表れだと私は読んでいる。確率が55%前後をうろついている局面は、方向を当てにいくには分が悪い。
したがって現時点の私の見方は、短期はニュートラル、中期は選別ロングである。具体的には、AI設備投資テーマを一括りで持つのをやめて、後編で整理したFCF充足度の軸で分けて持つ。自己資金で設備投資を賄えている企業と、外部調達に頼っている企業とでは、これから数か月の金利パスに対する耐性がはっきり違う。テーマで買う局面はもう終わっていて、バランスシートで選ぶ局面に入っている。
この見立てが崩れる条件も書いておく。来週の米CPIが明確に下振れし、それを受けて9月利上げ織り込みが40%を割り込んだ場合、割引率経路のストーリーそのものが一時的に無効化される。そのときはベースシナリオの比重を上げ、デュレーションの長い銘柄をむしろ買い戻す側に回る。ウォーシュ議長自身が講演で、PCEやCPIの直近の数字は予想より良かったと認めつつ「基調が意味のある形で改善したことを示すものではない」と述べていた。裏を返せば、基調の改善を示すデータが1本出れば、議長の論拠は弱まる。CPIはそのための最短の1本だ。
雇用統計は分子の話に見えて、実際には分母の話だった。9月のFOMCとCPIは、この2本の記事で示したシナリオを同時に採点する材料になる。
次号の記事案
- 案1:FOMC後の答え合わせ、3本まとめて採点 — 前編・後編・本編で提示した金利・ドル円・設備投資の3シナリオを、実際のFOMC結果と市場反応に照らして点数をつける。
- 案2:FCF自給率でAI設備投資銘柄を並べ替える — 「テーマで買う」から「バランスシートで選ぶ」への移行を、実際の財務データで銘柄レベルまで落とし込む。
- 案3:情報産業だけが雇用を減らしている件 — 今回の統計で唯一減少した情報産業を起点に、AIによる人員代替が損益にいつ表れるのかを検証する。
本文の事実関係と数値前提は、読者が確認できる一次情報・公的資料を優先して掲載している。
本記事は情報提供を目的としたものであり、特定の銘柄・サービス・契約条件の推奨や投資助言ではありません。執筆者は記事内で言及した銘柄にポジションまたは利害関係を持つ可能性があります。調査、翻訳、校正の一部に生成AIを利用していますが、最終的な内容はZYL0が確認しています。詳細は免責事項をご確認ください。
Why a Blowout Jobs Print Sinks Stocks: Rereading a 3x Beat Through the Discount Rate
I finished writing the two Warsh Shock pieces on the morning of September 4. By that evening, the market handed me a scoring sheet far sooner than I expected: the August employment report. I looked at the headline number and thought, this is going to pull stocks down. It did.
And yet, when I try to explain to someone why it pulls stocks down, I stumble more than I would like. The economy is strong, so stocks fall. That sentence trips up almost every new investor, and if I am honest, it tripped me up once too. So let me take the whole thing apart through a single piece of plumbing: the discount rate.
Start with where the print landed.
| Item | Consensus | Actual | Note |
|---|
| Nonfarm payrolls | +53,000 | +162,000 | Largest monthly gain since March |
| Unemployment rate | 4.1% | 4.1% | Held steady, as expected |
| June + July revisions | — | +55,000 combined | Erased July's reported job losses |
| Food services & drinking places | — | +59,000 | Main driver of the gain |
| Local government education | — | +42,000 | Second driver |
| Information industry | — | Shed jobs | Consistent with AI-related headcount cuts |
A consensus of +53,000 against an actual of +162,000 is roughly a threefold beat. On top of that, revisions to June and July added a combined +55,000, which rewrote the very fact that July had shown job losses. The narrative of a cooling labor market that had built up over recent months was overturned in a single morning.
What actually caught my eye first was not the headline but the composition. The gain was carried by food services and local government education, while the information industry shed jobs. In other words, employment fell in the sector where AI bites hardest and rose in face-to-face services where it does not. The strength inside this print does not necessarily mean the tech economy is strong. Hold that thought — it matters later.
Then the market responded in the direction that feels wrong.
| Measure | Move on Sept 4 | Level / note |
|---|
| S&P 500 | -0.38% | Closed at 7,718.60 |
| Nasdaq Composite | -0.29% | Closed at 26,506.99 |
| Dow Jones Industrial Avg | -0.51% | Down more than 260 points |
| US 2-year Treasury yield | Higher | Highest since January 2025 |
| September hike odds | 49.4% → 58% | CME FedWatch, day over day |
The economy is strong. Jobs were added. And all three major indexes closed lower — with the biggest decline coming not from the tech-heavy Nasdaq but from the Dow. That last detail matters, and I will come back to it.
Here is the core of it. "Good news is bad news" is a worn-out market phrase, and memorizing it as a slogan does nothing for you. What matters is knowing which pipe converts the good news into the bad news.
There is only one pipe: the discount rate.
A share price is the sum of future cash flows discounted back to present value. The numerator is future earnings; the denominator is the discount rate. A strong jobs print moves both.
- Numerator: strong economy → better revenue and earnings outlook → positive for prices
- Denominator: strong economy → higher odds of a hike → higher discount rate → negative for prices
What happened on September 4 was simply that the denominator moved more than the numerator. The market judged that the discount-rate effect of hike odds sliding from 49.4% to 58% outweighed the earnings effect of 162,000 additional jobs.
Is that really right? Or, more precisely: the numerator had already been largely priced in. Fed Chair Warsh, in his August 28 Jackson Hole remarks, stressed the strength of real activity, downplayed labor-market risk, and said high inflation should be the Fed's "predominant focus." If the Chair has already declared the economy strong, then an upside surprise in payrolls carries little new information for the numerator — while being decisively confirmatory for hike odds. The information is asymmetric.
That asymmetry is then amplified by the fact that discount-rate sensitivity varies enormously across equities.
| Equity type | Center of gravity of cash flows | Price impact of +1% discount rate | Examples |
|---|
| High-dividend, mature | 1–5 years (near) | Small | Staples, utilities |
| Typical quality compounder | 5–10 years | Moderate | Large-cap consumer |
| High-growth, front-loaded capex | 10–20 years (far) | Large | AI capex, SaaS |
| Pre-monetization theme names | 20+ years | Very large | Some AI-infrastructure names |
This is exactly bond duration logic. The farther out the center of gravity of the cash flows, the more elastic the price is to a change in the discount rate. Translated into equities: a stock bought for the earnings it will have is more rate-sensitive than a stock bought for the earnings it has.
Now back to the detail I parked: the Dow fell the most. On pure duration logic, the Nasdaq should have led the decline. Instead the Dow was down 0.51% against the Nasdaq's 0.29%. So this session was not a clean duration repricing. The cyclicals, financials, and capital-goods names that populate the Dow were also absorbing a separate channel — higher borrowing costs on real balance sheets. The discount-rate story is powerful, but it does not explain the whole tape, and it is worth holding it at that resolution rather than overselling it.
As set out in Part 2, combined 2026 capex across the four hyperscalers runs near $725 billion, up 77% year over year. And the funding structure behind it changed materially over the past year: the ratio of incremental debt financing to capital expenditure rose from roughly 9% in FY24 to about 32% on a 2026 trailing-twelve-month basis.
Lay those two numbers over the discount-rate discussion and you can see that AI-capex equities are exposed to rates twice over.
| Channel | Mechanism | Where it shows up |
|---|
| Discount rate (denominator) | Investment premised on distant payback → long duration | Valuation multiple |
| Funding (real cash) | About a third of capex funded by external debt → rates hit expense | P&L and free cash flow |
| Demand (numerator) | Customers' own capex appetite cools as rates rise | Orders and revenue |
An ordinary growth stock is exposed to the first channel only. Companies at the core of the AI buildout take the first and second simultaneously. When I wrote in Part 2 that the move from 9% to 32% was fast, what that speed actually means is this: compared with a year ago, there is now more than three times as much room for higher rates to walk straight into the income statement rather than stopping at the multiple.
From having taken an internal proposal from proof-of-concept through a capital approval in the hundreds of millions of yen and out the other side into execution, I can say that when an internal hurdle rate moves by a couple of points, projects with identical economics stop clearing the committee in the same way. Nobody ever says "we are stopping this because rates went up." What happens instead is that the review period stretches, extra sensitivity analysis gets requested, the program is split into phases — and a year later you notice the whole thing has slipped. Capex deceleration shows up as delay, not as an announcement. That is the single easiest thing to miss when reading the numbers.
There is a second timing problem. From the years I spent running TCAD process simulations in automotive EEPROM development, the lag between a demand signal and an actual production plan is measured in quarters — wafer starts to lot completion alone eats several. Even if the hyperscalers throttle orders, it does not reach NVIDIA's or the memory makers' reported numbers until the following quarter at the earliest. Which cuts the other way too: the fact that earnings look good right now is not evidence that higher rates are failing to bite. Equity prices front-run that lag. The Nasdaq's decline on September 4 was precisely that front-running.
In Part 2 I put the most weight on the "main case: partial deferral" scenario heading into the September FOMC. How does the jobs print change that? Briefly: I shift the probability mass slightly toward the main case, but I do not change the skeleton.
| Scenario | Content | Discount-rate implication | Implication for AI-capex names |
|---|
| Base: no hike | CPI undershoots, FOMC holds with a dovish tone | Long yields fall | Sharp rebound as the duration unwind reverses |
| Main: 25bp hike | One hike as priced, then wait and see | Front end up, long end limited | Selection intensifies; self-funded names win |
| Tail: hike plus hawkish guide | Hike accompanied by signals of further tightening | Whole curve shifts up | Funding channel hits directly; broad decline |
What nags at me behind these numbers is that the hike probabilities themselves do not agree across sources. CME FedWatch puts it at 49.4% on September 3 and 58% on September 4; press coverage has cited 52% to 59% for the same move; an August 31 reading came in at 66%. That is a spread of more than ten points. I read that dispersion not as measurement noise but as evidence that the market itself is not yet convinced. When the probability is loitering around 55%, betting on direction is a poor use of risk.
So my current stance is neutral on the short term, selectively long on the medium term. Concretely: stop holding the AI-capex theme as a single block, and split it along the free-cash-flow self-sufficiency axis laid out in Part 2. Companies that can fund their buildout from operating cash flow and companies leaning on external financing will show visibly different resilience to the rate path over the coming months. The phase where you buy the theme is over. This is the phase where you pick on the balance sheet.
Let me also state what would change my mind. If next week's US CPI comes in clearly below expectations and September hike odds fall back under 40%, the discount-rate story is temporarily voided. In that case I would raise the weight on the base scenario and turn into a buyer of longer-duration names rather than a seller. Warsh himself conceded in his remarks that recent PCE and CPI prints came in better than expected, while adding that they do not signal that underlying trends have meaningfully improved. Read the other way: one data point that does show improvement in the trend weakens the Chair's own argument. CPI is the shortest route to that data point.
The jobs report looked like a story about the numerator. It was a story about the denominator. The September FOMC and next week's CPI will score the scenarios from all three of these pieces at once.
Next Issue Ideas
- Idea 1: Scoring all three pieces after the FOMC — Grade the rate, dollar-yen, and capex scenarios from Parts 1, 2, and this piece against the actual FOMC outcome and market reaction.
- Idea 2: Re-ranking AI-capex names by FCF self-sufficiency — Turn "pick on the balance sheet, not the theme" into an actual single-name ranking built from reported financials.
- Idea 3: The one sector that shed jobs — Start from the information industry's decline in this print and test when AI-driven headcount substitution actually reaches the income statement.
Facts and figures in this piece prioritize primary and official sources readers can verify themselves.
This article is provided for informational purposes only and is not a recommendation or investment advice regarding any specific security, service, or contract terms. The author may hold positions or have interests in the names discussed. Generative AI was used for parts of the research, translation, and proofreading, but the final content has been reviewed by ZYL0. Please see the disclaimer for details.