カーグ島という単一障害点:輸出ターミナル一極集中が生む非対称リスク
前編・後編を書き終えて2週間も経たないうちに、次の材料が飛び込んできた。9月5日、カーグ島付近で爆発音が相次いだというニュースが流れてきたときの実感は、正直「またか」だった。だが今回は、これまでと種類が違う。ホルムズ海峡の通航量の話ではなく、狙われたのは(あるいは狙われたと報じられたのは)海峡そのものではなく、島に立つ一つの積出ターミナルだったからだ。
前編・後編では、ホルムズ海峡という航路のリスクを検証してきた。通航量が9割減っても喜望峰迂回という逃げ道はあるし、備蓄を放出すれば時間を買える。だが今回の一件は、もっと的が絞られている。海峡は無数の船が通る面のリスクだが、積出ターミナルはたった一つの点だ。この違いは、投資家にとって決定的に重要だと私は考えている。今回はカーグ島そのものを主役に据えて、この一極集中がどういう非対称性を生むのかを掘り下げたい。
最初にこのニュースに触れたとき、私が引っかかったのは事実関係そのものより、情報の出どころがバラバラだという点だった。
イランの半官営通信社Tasnimは、カーグ島の錨地付近で小型タンカー1隻が「米軍の4発のミサイル」で被弾したと報じ、死傷者はなく乗員は避難中としている。一方、同じくイラン系のFarsは爆発音のみを報じ、煙は確認されておらず原因は不明としている。イラン政府からの公式声明は今のところなく、米中央軍(CENTCOM)も取材に応じていない。どちらの報道を信じるにせよ、一次情報が存在しないまま数字だけが独り歩きしている、というのが9月5日時点の実態だ。
この4日前、8月31日にはトランプ大統領がカーグ島を「粉々に吹き飛ばした」とするAI生成とみられる動画を投稿していた。Reutersはこの主張を裏付ける証拠を確認できなかったと報じ、イラン国営石油会社(NIOC)のCEOは「トランプのツイートは笑い話だ」と一蹴している。同じ8月31日、Brent原油は前日比+2.95%の90.70ドルまで上昇した。誇張された破壊映像と、実際の価格反応との間にあるギャップそのものが、この局面の情報戦としての性格を物語っていると思う。
| 日付 | 出来事 | 確認状況 |
|---|
| 8/31 | トランプ大統領がカーグ島「破壊」とするAI生成疑いの動画を投稿 | Reutersが裏付け証拠なしと報道、NIOCは否定 |
| 8/31 | Brent原油が前日比+2.95%の$90.70まで上昇 | 一次データ(市場価格)として確認可能 |
| 8/31 | ホルムズ海峡の通航が1日あたり3隻まで急減(平時比約85隻)、待機船約335隻 | 観測データとして報告あり |
| 9/5 | カーグ島錨地付近で爆発音、Tasnimは小型タンカー1隻の被弾を報道 | イラン政府・米CENTCOMとも公式確認なし |
| 9/5 | Farsは爆発音のみ報道、煙は未確認、原因不明とする | Tasnimの報道と食い違い |
この表を作りながら思ったのは、8月末から9月頭にかけて、実際の被害規模よりも「情報がどう伝えられるか」自体が市場を動かす変数になっているということだ。ホルムズの通航量が1日3隻まで落ちたという数字は前編で確認した8月中旬の1日約12隻からさらに悪化しており、こちらのほうが実は地味に深刻な変化だと私は見ている。
ここで一度、時計の針を半年前に戻す。今回の一件を評価するには、比較対象が要る。
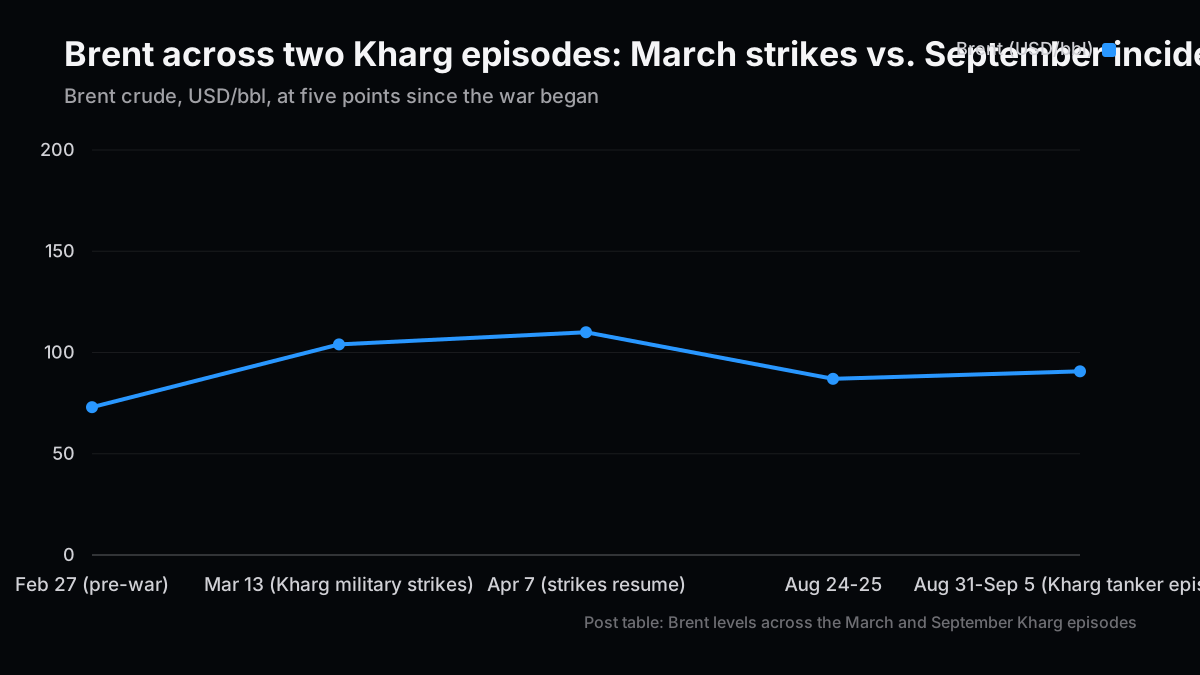
3月13日、米軍はカーグ島周辺の軍事施設90か所以上を空爆した。攻撃対象は掩体壕・レーダー・弾薬庫であり、石油輸出インフラそのものは意図的に避けられている。それでもBrent原油は開戦(2月末)からの上げ幅が40%を超え、100ドル台に乗せた。CNBCの報道ではこの週半ばの水準は1バレル104ドル前後とされている。攻撃はさらに4月7日にも似た形で再開され、このときはBrentが110ドル前後、WTIが115ドル前後まで上振れした。この時も石油インフラは標的から外され、衛星画像では攻撃の数日後にもタンカー3隻がターミナルに係留されたままだったと報じられている。
つまり3月・4月の連続空爆は、「軍事施設だけを狙っても、石油インフラを狙う可能性をちらつかせるだけで、Brentは100ドルを超える」という事実を示した回だった。今回の9月5日の一件は、これとは輪郭が異なる。狙われた(とされる)対象は軍事施設ではなく、錨地に停泊していた民間の小型タンカーだ。ターミナルの中核設備そのものが損傷したという確証は、少なくとも私が確認できた範囲の報道には出ていない。
| 時期 | Brent原油 | 標的 |
|---|
| 2/27(開戦前) | $73/bbl | ― |
| 3/13(カーグ軍事施設空爆) | 約$104/bbl | 掩体壕・レーダー・弾薬庫(石油インフラ回避) |
| 4/7(空爆再開) | $110〜115/bbl前後 | 前回と同様、石油インフラ回避 |
| 8/24-25 | $86〜88/bbl | ―(前編・後編で確認済みの水準) |
| 8/31-9/5(カーグ島タンカー疑惑) | 約$90.70/bbl(+2.95%) | 錨地の小型タンカー(未確認) |
本当にそうか、と自分に問い直してみる。足元の水準($90.70)は、3月・4月のピーク($104〜115)よりずっと低い。だからといって「今回は大したことがない」と結論づけるのは早計だと私は思っている。理由は次の節で説明する、攻撃の的が「軍事施設」から「積出インフラそのものに近い場所」へと少しずつにじり寄っているという構造の変化のほうが、水準そのものより重い意味を持つと考えているからだ。
ここが本稿でいちばん言いたいことだ。前編・後編で扱ったホルムズ海峡のリスクと、カーグ島のリスクは、似ているようでまったく別の統計的性質を持っている。
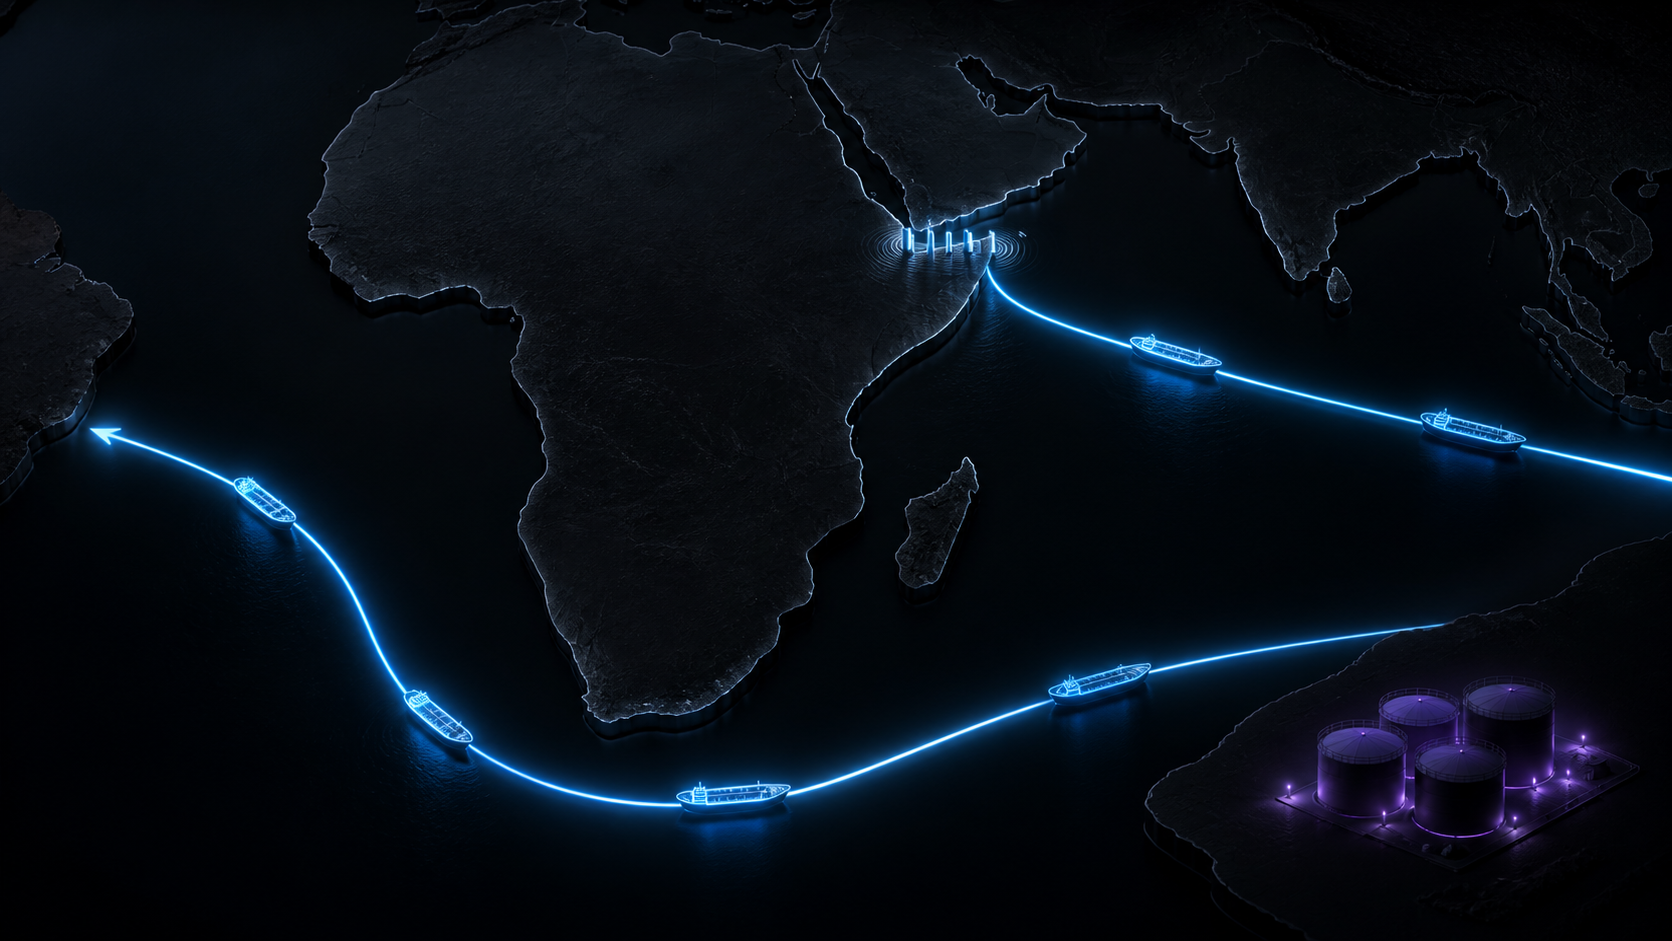
ホルムズは面のリスクだ。通航量が9割減っても、喜望峰経由という迂回路が(コストと時間はかかるが)物理的に存在する。前編で確認した通り、迂回の追加コストは船隊全体で週4,000万〜5,000万ドル、日数にして10〜14日の増加で済む。痛いが、詰んではいない。
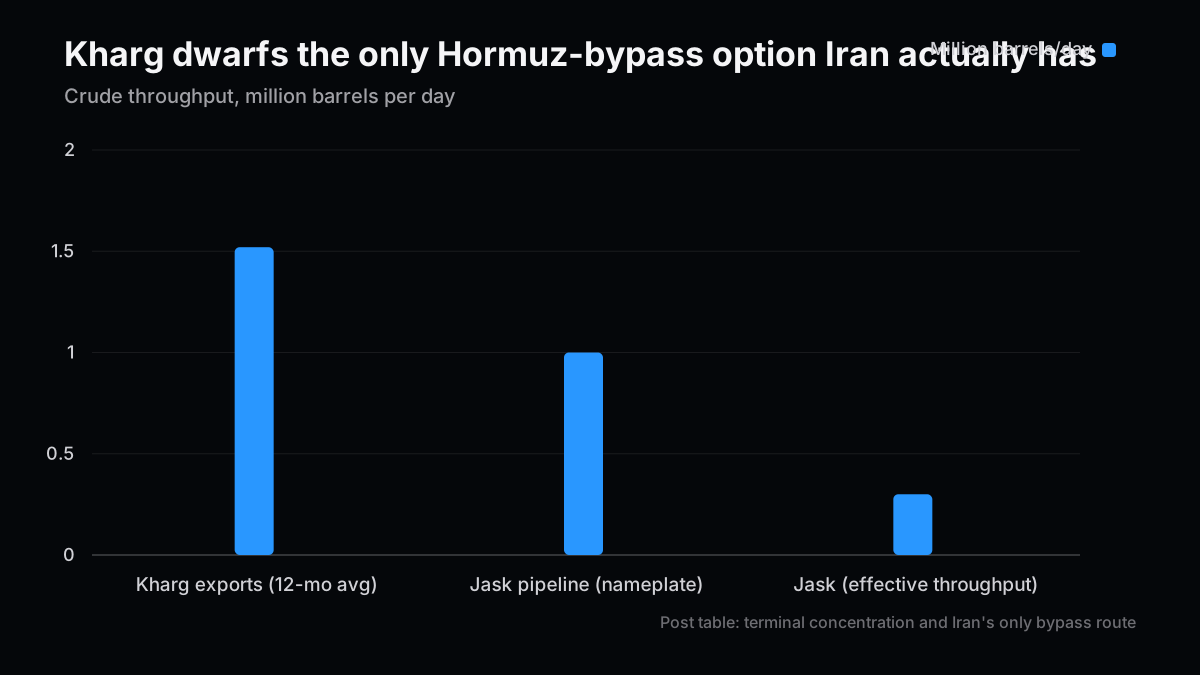
カーグ島は点のリスクだ。Kplerのデータでは、直近12か月のイラン原油輸出587百万バレルのうち553百万バレル、日量換算で1.52百万バレルがカーグ島経由——シェアにして約94%に達する。カーグの貯蔵タンク総容量は約31百万バレルで、3月上旬時点の在庫率は約58%だった。しかもカーグの水深はイラン沿岸で唯一、VLCC(超大型原油タンカー)が直接1回あたり最大200万バレルを積み込める深さを持つ。つまり「代わりのターミナルで積めばいい」という選択肢が、そもそもイラン国内にほとんど存在しない。
唯一の迂回策とされるのがオマーン湾側のJask(ジャスク)ターミナルだが、これが驚くほど心もとない。Goreh-Jaskパイプラインの設計上の能力は日量100万バレルとされるものの、上流の原油配分と受け入れ設備の制約から、実効スループットは日量30万バレル程度にとどまるとみられている。カーグの過去実績(日量150万〜200万バレル)と比べれば、Jaskが吸収できるのはせいぜい2割弱にすぎない。ホルムズと違って、「迂回路はあるが細くて遠い」というレベルですらなく、「迂回路の看板はあるが実質ほぼ機能しない」に近い。
ここで効いてくるのは、集計データを読むときの基本的な注意だ。国・業界単位で集計された平均値は、個別設備レベルまで分解しない限り「実はどこか一点に負荷が偏っている」という構造をきれいに隠してしまう。平均の背後にある突出した外れ値は、粒度を一段下げて初めて見えてくる。それと同じ理屈で、「イランは日量約160万バレルを輸出している」という国レベルの数字だけを見ていては、そのほぼ全量が一つの島の一つのターミナルに集約されているという事実は見えてこない。集計値を疑う癖があったから、9月5日のニュースを見た瞬間に「これは海峡の話とは違う統計構造だ」と反射的に感じたのだと思う。
輸出の受け手側にも、この一極集中の裏返しが表れている。イラン産原油の輸出のうち大半は中国(主に山東省のいわゆる「ティーポット」精製業者)向けとされ、カーグは「出荷の9割」を担うと報じられている。8月のブロケード強化を受けて、ペルシャ湾・オマーン湾の外にあるイラン原油の在庫は約8,300万バレルまで減少した(7月中旬以前の1億バレル超から)。シンガポール近海の浮体在庫は約4,000万バレル。需給の逼迫を映す形で、イラン産軽質油(Iranian Light)の値付けは、わずか1週間でBrent対比マイナス3.50ドルの割引からプラス3.50ドルのプレミアムへと反転したと報じられている。買い手が品薄を織り込み始めている、という一次的な証拠だと私は読んでいる。
| 指標 | 数値 | 含意 |
|---|
| カーグ島の輸出シェア | イラン原油輸出の約94%(日量1.52百万バレル) | 代替ターミナルが実質存在しない |
| Jaskパイプライン実効能力 | 日量約0.3百万バレル(名目1.0百万バレル) | カーグ実績の2割弱に過ぎない |
| 域外在庫(ペルシャ湾・オマーン湾外) | 約8,300万バレル(7月中旬前は1億バレル超) | 供給逼迫が数字に表れ始めている |
| Iranian Lightの対Brentスプレッド | 1週間で−3.50ドル→+3.50ドルへ反転 | 買い手が品薄を織り込み |
前編・後編で組み立てた投資フレームは、あくまで海峡の通航リスクを前提にしていた。カーグ島という点のリスクをそこに重ねると、いくつかの見え方が変わってくる。
まず保険市場から見ていく。Lloyd's Market Association(LMA)の声明を確認したところ、意外な発見があった。ホルムズ関連の船体戦争保険について、Lloyd's海上戦争保険市場の参加者のうち88%が引き続き引受意欲を持ち、貨物保険では90%超が同様だという。つまり「保険が付かないから船が動かない」のではなく、「船長・船主が安全性を独自に判断して止めている」というのが実態に近い、とLMAは明言している。3月以降、1万トン超の船舶でホルムズを通過したのはわずか111隻(バルカー39隻、原油タンカー23隻、コンテナ船16隻など)にとどまり、JMIC(合同海事情報センター)は域内の商船・インフラへの攻撃を23件確認している。この数字が意味するのは、保険という資本の蛇口自体は閉まっていないということだ。だとすれば、安全性の判断さえ変われば、市場は保険キャパシティの制約を受けずに正常化できる余地がある——これは後編で立てたタンカー・保険バスケットの前提を、部分的に補強する材料だと私は見ている。
ただし、ここからが本題だ。後編で書いたタンカー・バスケット(FRO/STNG/DHT/INSW)の投資アイデアは、「輸送が詰まる→運賃が上がる」という海峡型のロジックに立脚していた。カーグ島の中核設備が本格的に損傷するシナリオでは、このロジックが逆に働く可能性がある。運ぶべき貨物そのものが物理的に減るなら、タンカー需要はむしろ縮小するからだ。後編ではLNGの代替供給網について、カタールのRas Laffan施設の復旧に3〜5年かかるという固い見通しを紹介した。カーグ島の中核設備が同規模の損傷を受けた場合、原油側にも同じ時間軸のテールリスクが生じ得る、というのが私の見立てだ。ここは後編の結論を単純に延長しただけの話ではなく、「輸送の目詰まり」と「積出そのものの喪失」はまったく別の回復曲線を描くという前提の転換だと考えてほしい。
だとすれば、いま厚く持つべきはどこか。海上戦争保険のChubb($4億のコンソーシアム、6月19日稼働)とBeazley(合計$10億、4月稼働)は、後編で書いた通りポートフォリオ全体のごく一部のプレイであることに変わりはないが、テールシナリオでのオプショナリティとしての価値はむしろ上がっていると私は見ている。タンカー・バスケットは海峡型のリスクに対する読みとしては維持しつつ、カーグ本体が損傷した場合のヘッジにはならないことを織り込んでおく必要がある。LNG代替供給のCheniere・Venture Globalは、Ras Laffanの複数年ロングと同じ論理で、カーグの複数年ロングとしても機能し得る二重の意味を持ち始めている。
| セクター/銘柄 | 海峡型リスクへの感応度 | ターミナル型リスクへの感応度 |
|---|
| タンカー・バスケット(FRO/STNG/DHT/INSW) | 高い(運賃上昇で追い風) | 限定的〜逆風(貨物量そのものが減る) |
| 海上戦争保険(Chubb/Beazley) | 中(保険料上昇で追い風) | 高い(テールシナリオのオプショナリティ) |
| LNG代替供給(Cheniere/Venture Global) | 低い | 高い(Ras Laffanと同型の複数年ロング) |
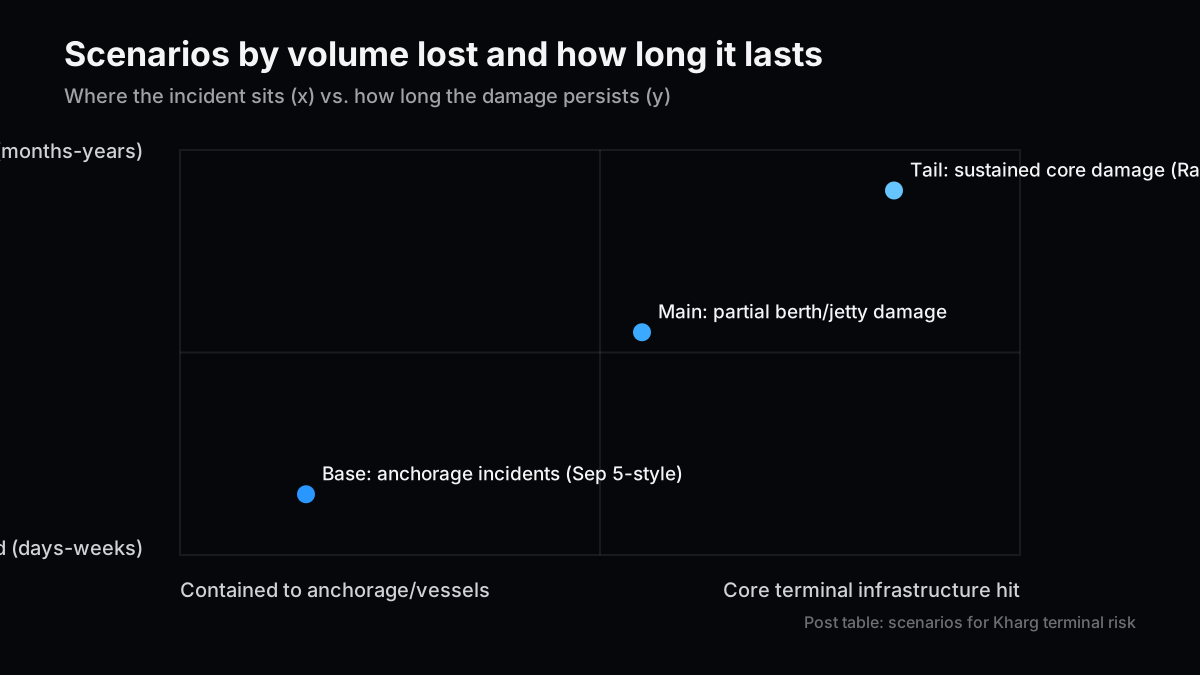
ここまでの材料を、ベース・メイン・テールの3シナリオに整理する。軸になるのは、9月5日の一件が「錨地の事件」で収束するのか、それとも「ターミナル本体」へとにじり寄っていくのかという一点だ。
| シナリオ | 内容 | Brent | 投資アングルへの含意 |
|---|
| ベース:錨地に限定 | 9月5日型の事件が散発するが、積出設備本体は無傷が続く | $85〜95/bbl | タンカー・バスケットは海峡型ロジックのまま維持 |
| メイン:桟橋一部損傷 | 積出用の桟橋・配管の一部が損傷し、数週間〜数か月の能力低下 | $100〜120/bbl | 保険を積み増し、タンカーは選別、LNG代替を厚くする |
| テール:中核設備損傷 | 貯蔵・ポンプ設備など中核が損傷し、複数年規模の復旧が必要になる | $130超 | タンカー需要そのものが縮小、LNG代替供給が構造的ロングに |
私自身の現時点のポジションは、短期はニュートラル、中期は選別ロングだ。タンカー・バスケットは海峡型のロジックを引き続き支持しつつ、カーグ本体の損傷という尾のリスクに対しては、保険のオプショナリティとLNG代替供給という別のヘッジを併走させる。前編で確認した通り、ホルムズの通航データとBrent-BDTIスプレッドはすでに開戦前の第1本目の記事(#1)で示した先行指標仮説の答え合わせに使われたが、今回のカーグ島リスクについては、まだ答え合わせできるだけの実績データが積み上がっていない。ここは正直に「まだ分からない」と書いておきたい。
この見立てが崩れる条件も明示しておく。衛星画像などの第三者ソースでカーグ島の積出桟橋・貯蔵設備への直接的な損傷が確認され、かつそれに伴って日量輸出が30%以上、30日以上にわたって低下したことが確認された場合、それはもはやテールシナリオではなく現実のメインシナリオへの移行だと判断し、タンカー・バスケットの比重を落としてLNG代替供給・保険オプショナリティへ資金を寄せる。逆に、Jaskの拡張計画が具体化し実効スループットが日量100万バレル規模に近づくようなら、「代替がない」という非対称性の前提そのものが崩れるので、その時点でこの記事の結論全体を見直すつもりだ。
次号の記事案
- 案1:カーグ島被害の一次データ答え合わせ — 衛星画像や輸出統計が確認できた段階で、本記事のベース・メイン・テールのどのシナリオに着地したかを検証する。
- 案2:ティーポット精製業者の代替調達先シフト — カーグ供給が細る中、中国の独立系精製業者がロシア・イラク・UAE産原油へどこまでシフトできるかを、価格スプレッドのデータで深掘りする。
- 案3:Jask拡張計画の現実味を検証する — もしイランがJaskの実効能力を引き上げる投資を発表したら、本記事の「代替がない」という非対称性の前提がどこまで崩れるかを再検証する。
本文の事実関係と数値前提は、読者が確認できる一次情報・公的資料を優先して掲載している。
本記事は情報提供を目的としたものであり、特定の銘柄、サービス、契約条件の推奨や投資助言ではありません。執筆者は記事内で触れた銘柄やサービスにポジションまたは利害関係を持つ可能性があります。調査、翻訳、校正の一部に生成AIを利用していますが、最終的な内容はZYL0が確認しています。詳細は免責事項をご確認ください。
Kharg Island, the Single Point of Failure: How Terminal Concentration Creates Asymmetric Oil Risk
Less than two weeks after finishing Parts 1 and 2 of this series, the next data point landed. On September 5, reports of explosions near Kharg Island started circulating, and my honest first reaction was "again?" But this one is a different animal. It is not about Hormuz transit volumes. What was reportedly targeted was not the strait at all — it was a single loading terminal sitting on one island.
Parts 1 and 2 examined the risk sitting in the shipping lane — the Strait of Hormuz. Even with transits down 90%, there was an escape valve: the Cape of Good Hope reroute, and stockpile releases to buy time. This latest episode is narrower and sharper. Hormuz is a diffuse risk spread across hundreds of vessels. A loading terminal is a single point. That distinction matters enormously for how an investor should think about this, and this piece is built around unpacking exactly what kind of asymmetry that concentration creates.
What actually caught my attention first was not the substance of the claims but how inconsistent the sourcing was.
Iran's semi-official Tasnim news agency reported that a small tanker was struck near Kharg Island's anchorage by "four US missiles," with no casualties and the crew evacuating. Fars, another Iran-linked outlet, reported only that explosions were heard, with no smoke confirmed and the cause undetermined. There has been no official statement from the Iranian government, and US Central Command has not responded to requests for comment. Whichever account you believe, the numbers are circulating without a confirmed primary source underneath them — that is the actual state of play as of September 5.
Four days earlier, on August 31, President Trump posted a video, apparently AI-generated, claiming Kharg Island had been "blown to smithereens." Reuters found no evidence supporting the claim, and the CEO of Iran's state oil company (NIOC) dismissed it as "laughable." That same day, Brent crude rose 2.95% to $90.70. The gap between an exaggerated destruction claim and the actual size of the price reaction tells you something about how much of this episode is information warfare rather than confirmed physical damage.
| Date | Event | Verification status |
|---|
| Aug 31 | Trump posts a video, apparently AI-generated, claiming Kharg Island was destroyed | Reuters found no supporting evidence; NIOC denied it |
| Aug 31 | Brent crude rises 2.95% to $90.70 | Confirmed via market pricing |
| Aug 31 | Hormuz transits fall to roughly 3 vessels a day (vs. ~85 pre-war baseline), ~335 ships anchored | Reported observational data |
| Sep 5 | Explosions heard near Kharg's anchorage; Tasnim reports a small tanker struck | No official confirmation from Iran or US CENTCOM |
| Sep 5 | Fars reports explosions only, no smoke confirmed, cause undetermined | Contradicts the Tasnim account |
Building this table drove home something I hadn't fully registered until I laid it out: right now, how an event gets reported is doing more work moving markets than the actual, confirmed scale of damage. The Hormuz transit collapse to roughly 3 vessels a day is a larger deterioration than the roughly 12 vessels a day I flagged as the mid-August average in Part 1, and honestly, I think that quieter number is the more consequential development.
Let me rewind six months, because evaluating this episode needs a reference point.
On March 13, US forces struck more than 90 Iranian military sites near Kharg Island — bunkers, radar installations, and ammunition depots. Oil export infrastructure was deliberately spared. Even so, Brent's gain since the war began in late February exceeded 40%, pushing it past $100 a barrel; CNBC's reporting put the mid-week level around $104. The strikes resumed in similar form on April 7, when Brent ran up to roughly $110 and WTI to roughly $115. Again, oil infrastructure was left untouched — satellite imagery days later reportedly still showed three tankers moored at the terminal.
In other words, March and April demonstrated that striking only military assets, while merely gesturing at the possibility of hitting oil infrastructure, was enough to push Brent above $100. The September 5 episode has a different shape. What was reportedly targeted was not a military installation but a small commercial tanker sitting at anchorage. As far as I can verify from the reporting I've reviewed, there is no confirmation that the core terminal infrastructure itself sustained damage.
| Period | Brent | Target |
|---|
| 2/27 (pre-war) | $73/bbl | — |
| 3/13 (Kharg military strikes) | ~$104/bbl | Bunkers, radar, ammo depots (oil infrastructure spared) |
| 4/7 (strikes resume) | ~$110-115/bbl | Same pattern, oil infrastructure spared again |
| 8/24-25 | $86-88/bbl | — (established level from Parts 1 and 2) |
| 8/31-9/5 (Kharg tanker episode) | ~$90.70/bbl (+2.95%) | Small tanker at anchorage (unconfirmed) |
Is that really the right read? The current level ($90.70) sits well below the March-April peak ($104-115). It would be premature to conclude "this one doesn't matter." My reason for hesitating there is the subject of the next section: the target is edging, incrementally, from "military installation" toward "something closer to the export infrastructure itself." That drift in what's being targeted matters more than the current price level does.
This is the core argument of this piece. The Hormuz risk from Parts 1 and 2 and the Kharg risk look similar on the surface, but they have entirely different statistical properties.
Hormuz is a surface risk. Even with transits down 90%, the Cape of Good Hope reroute physically exists, at a cost in time and money. As established in Part 1, the fleet-wide added cost of that detour runs $40-50 million a week and 10-14 extra days. Painful, but not fatal.
Kharg is a point risk. Kpler's data shows that over the trailing 12 months, 553 of Iran's roughly 587 million barrels of crude exports — a daily average of 1.52 million barrels — moved through Kharg. That is a concentration of roughly 94%. Kharg's total storage capacity runs around 31 million barrels, with inventory at about 58% of capacity as of early March. And Kharg's deep water is unique along Iran's coastline in letting a VLCC load up to 2 million barrels directly in a single lift. The option of "just load somewhere else" barely exists inside Iran.
The one nominal alternative is the Jask terminal on the Gulf of Oman side, and it is strikingly thin. The Goreh-Jask pipeline's design capacity is quoted at 1 million barrels a day, but upstream allocation constraints and limited receiving infrastructure at Jask mean effective throughput runs closer to 300,000 barrels a day. Against Kharg's historical throughput of 1.5-2.0 million barrels a day, Jask can absorb, at best, less than a fifth. Unlike Hormuz, where the alternative is "narrow and slow but real," Jask is closer to "an alternative on paper that barely functions."
A basic caution about reading aggregated data is doing real work here. Any average computed at the country or industry level hides, by construction, whether the underlying load is actually concentrated at a single node — you only see it once you break the aggregate down to the facility level. Outliers that an average completely obscures show up only when you drop one level of granularity. In the same way, the headline "Iran exports roughly 1.6 million barrels a day" tells you nothing about the fact that nearly all of it funnels through one island's one terminal. That habit of distrusting aggregates is exactly why my instinct on seeing the September 5 news was that this is a structurally different kind of risk from anything Hormuz-related.
The buy-side shows the mirror image of this concentration. The bulk of Iranian crude reportedly flows to China, largely to Shandong's independent "teapot" refiners, and Kharg is reported to handle roughly 90% of those shipments. Following the tightened blockade in August, Iranian crude held outside the Persian Gulf and Gulf of Oman fell to around 83 million barrels, down from over 100 million before mid-July. Floating storage near Singapore sits around 40 million barrels. In a sign of buyers pricing in scarcity, Iranian Light crude reportedly flipped from a $3.50 discount to a $3.50 premium against ICE Brent within a single week. I read that as early, concrete evidence that buyers are starting to price the shortage in.
| Metric | Figure | Implication |
|---|
| Kharg's export share | ~94% of Iranian crude exports (1.52M bbl/day) | No real alternative terminal exists domestically |
| Jask pipeline effective capacity | ~0.3M bbl/day (nameplate 1.0M bbl/day) | Under a fifth of Kharg's historical throughput |
| Crude held outside the Gulf/Gulf of Oman | ~83M barrels (down from over 100M before mid-July) | Supply tightness starting to show up in the data |
| Iranian Light vs. Brent spread | Flipped from -$3.50 to +$3.50 within a week | Buyers pricing in scarcity |
The investment framework I built in Parts 1 and 2 was calibrated to transit risk through the strait. Overlay Kharg's point risk on top of that, and several of those calls need adjusting.
Start with insurance. Reviewing the Lloyd's Market Association's statement produced a genuine surprise. On Hormuz-linked hull war risk, 88% of Lloyd's marine war market participants report continued appetite to underwrite, and more than 90% say the same for cargo. In other words, "ships aren't moving because insurance isn't available" is the wrong read — the LMA states plainly that the actual constraint is shipmasters and owners independently assessing the safety risk as too high. Since March, only 111 vessels over 10,000 dwt have transited Hormuz (39 bulk carriers, 23 crude tankers, 16 containerships, and others), and JMIC has documented 23 attacks on commercial vessels and infrastructure in the region. What that tells you is that the capital tap for insurance itself has not shut off. If that's true, the market can normalize quickly once the safety assessment shifts, without being capacity-constrained on the insurance side — which is, if anything, a partial reinforcement of the tanker-and-insurance basket thesis from Part 2.
Here's where it gets more complicated, though. The Part 2 tanker basket call (FRO/STNG/DHT/INSW) rested on a strait-type logic: shipping gets jammed, freight rates rise. In a scenario where Kharg's core infrastructure sustains real damage, that logic can invert. If the cargo itself physically disappears, tanker demand should shrink, not grow. In Part 2, I noted that Qatar's Ras Laffan LNG facility carries a hardened 3-5 year repair estimate. If Kharg's core infrastructure took comparable damage, crude would face a tail risk on a similar timeline. This is not simply extending Part 2's conclusion — it is a shift in the underlying premise: a shipping bottleneck and the physical loss of a loading facility trace completely different recovery curves.
So what should carry the most weight right now? Chubb's $400 million war-risk consortium (live since June 19) and Beazley's $1 billion consortium (launched in April) remain, as I wrote in Part 2, small slices of much larger diversified portfolios — but their optionality value in a tail scenario looks higher to me now than it did then. I'd keep the tanker basket call as a read on strait-type risk while explicitly acknowledging it does not hedge damage to Kharg itself. The LNG alternative-supply names, Cheniere and Venture Global, start to carry a dual role: the same multi-year long thesis that applies to Ras Laffan's rebuild timeline now also applies, by the same logic, to a Kharg-damage scenario.
| Sector/Name | Sensitivity to strait-type risk | Sensitivity to terminal-type risk |
|---|
| Tanker basket (FRO/STNG/DHT/INSW) | High (freight spikes are a tailwind) | Limited to negative (less cargo to carry) |
| Marine war-risk insurers (Chubb/Beazley) | Moderate (premium spikes are a tailwind) | High (tail-scenario optionality) |
| LNG alternative supply (Cheniere/Venture Global) | Low | High (same multi-year long as Ras Laffan) |
Pulling this together into base, main, and tail cases. The pivot is whether the September 5 episode stays contained to the anchorage or gradually creeps toward the terminal itself.
| Scenario | Description | Brent | Implication for positioning |
|---|
| Base: contained to anchorage | Sep 5-style incidents recur, but core loading infrastructure stays undamaged | $85-95/bbl | Keep the tanker basket call on strait-type logic |
| Main: partial berth damage | Loading berths or pipework take partial damage, capacity dips for weeks to months | $100-120/bbl | Add insurance, get selective on tankers, weight LNG alternatives more |
| Tail: core infrastructure damage | Storage or pumping infrastructure takes core damage, requiring a multi-year rebuild | $130+ | Tanker demand itself contracts; LNG alternative supply becomes a structural long |
My own current stance: neutral on the short term, selectively long on the medium term. I'm keeping the tanker basket as a read on strait-type logic, while running insurance optionality and LNG alternative supply in parallel as a separate hedge against a Kharg-specific tail. As covered in Part 1, the Hormuz transit data and the Brent-BDTI spread were already used to grade the leading-indicator hypothesis I set out before the war began in Idea 1 (Part 1's opening piece). This Kharg-specific risk has not yet accumulated enough of a track record for that kind of grading. I want to be upfront that this part is genuinely still unresolved for me.
Let me state explicitly what would change my mind. If third-party sources — satellite imagery, for instance — confirm direct damage to Kharg's loading berths or storage infrastructure, and daily export volume is verified to have fallen by more than 30% for more than 30 days, that would no longer be a tail scenario — it would be the main scenario actually materializing, and I would shift weight out of the tanker basket and into LNG alternative supply and insurance optionality. Conversely, if Iran's Jask expansion plans firm up and effective throughput approaches something like 1 million barrels a day, the entire premise of "no real alternative exists" would erode, and I would need to revisit this piece's conclusions from the ground up.
Next Issue Ideas
- Idea 1: Grading the Kharg damage claims against primary data — Once satellite imagery or export statistics are verifiable, check which of the base, main, or tail scenarios this piece actually landed on.
- Idea 2: Where China's teapot refiners source around Kharg — As supply from Kharg tightens, how far can independent Chinese refiners shift toward Russian, Iraqi, or UAE crude, tracked through price-spread data.
- Idea 3: Testing whether Jask expansion is real — If Iran announces investment to raise Jask's effective capacity, how much of this piece's "no real alternative" asymmetry actually erodes.
Facts and figures in this piece prioritize primary and official sources readers can verify themselves.
This article is for informational purposes only and does not constitute investment advice or a recommendation of any specific stock, service, or contract structure. The author may hold positions or interests related to companies or services mentioned. Generative AI was used for parts of research, translation, and proofreading, with final review by ZYL0. See the disclaimer for details.