AIの社債ラッシュは米長期金利を押し上げたか:ハイパースケーラーの起債とネオクラウドの信用ストレス
本稿は公開情報のみに基づく外部からの読み方であり、各社への取材や非公開資料は使っていない。債券の価格と利回りは、特記のない限り報道や公的データの値である。
10月7日、米国の10年債利回りは一時5.36%、30年債は5.73%をつけた。どちらも2002年以来の高さだ。その1週間後、AIクラウドのCoreWeaveの社債は額面の8割を割り、利回りは15%を超えた。
この2つの数字を並べると、一つの筋書きが浮かぶ。ハイパースケーラーがAIのために社債を大量に発行し、その重みで長期金利が上がった。そして一番弱い借り手から、信用が崩れ始めている──。
筋は通っている。ただ、私はこの筋書きを、数字で一度ばらしてから信じたいと思った。
9月の金利上昇とハイテク設備投資の記事では、利上げが来れば設備投資の減速に警戒を一段上げる、と書いた。その利上げは9月16日に来た。FRBは政策金利を0.25%引き上げ、3.75〜4.00%とした。採決は12対0だった。ところが設備投資の計画は減らず、2027年には4社合計で1兆ドルを超えるという見方のほうが強まっている。圧力が出たのは、私が想定した場所ではなかった。
前回の800V DCの認証ゲートの記事で追ったのは、データセンターの建屋の中で電気を通すための許可だった。今回は、その建屋を建てるお金の側を見る。
先に結論を書くと、ハイパースケーラーの起債は「量」と同じくらい「長さ」が目立つ。
J.P. Morgan Asset Managementの8月20日の集計では、Alphabet・Amazon・Meta・Microsoft・Oracleの5社は、2026年に入ってから投資適格の社債を2,190億ドル発行した。うち620億ドル相当はユーロや円などドル以外の通貨だ。米ドル建ての投資適格社債の発行に占める比率は、2022〜24年の2%から、2026年は9%に上がる見込みだという。IMFも10月13日の国際金融安定性報告書で、世界の投資適格社債の発行に占めるハイパースケーラーの比率が、2024年の1%未満から2026年は約10%に上がったと指摘したと報じられている。
主な案件を並べると、次のようになる。
| 発行体 | 時期 | 規模 | 一番長い年限 | 条件など |
|---|
| Oracle | 2026年2月 | 200億〜250億ドル(8本立て) | 非公表 | 10年債は国債+145bp。注文は約1,290億ドルで過去最大 |
| Alphabet | 2026年2月 | 約320億ドル相当(多通貨) | 100年(ポンド建て) | 100年債10億ポンドに95億ポンドの注文。英国債+120bp |
| Amazon | 2026年3月 | ドル建て370億ドル(11本)+145億ユーロ | 50年(2076年満期) | 最長債は国債+130bp。注文は約1,260億ドル |
| Meta | 2026年4月 | 200億〜250億ドルを計画(最大6本) | 40年(2066年満期) | 当初の提示は国債+最大180bp |
| Microsoft | — | 2026年の大型起債は確認できなかった | — | 支出の大半を営業キャッシュフローでまかなう |
表で私が引っかかったのは、年限の長さだ。TwentyFour Asset Managementの9月3日の分析によれば、2025〜26年のハイパースケーラーの発行のうち41%は満期が15年を超える。社債全体の指数では16%にすぎない。PIMCOの6月1日の集計では、5月までの10年物の投資適格社債の発行の約13%(約210億ドル)、30年物の30%超(約320億ドル)をハイパースケーラーが占めた。
長い社債を大量に出せば、長期の国債と同じ買い手の財布を取り合う。生命保険や年金だ。だから「長期金利を押し上げた」という筋書きには、仕組みの上での根拠がある。
一方で、値段の付き方を見ると、話は少し違って見える。J.P. Morganによれば、ハイパースケーラーの社債の上乗せ金利(スプレッド)は年初から約30bp広がった。社債全体の指数は2bpしか動いていない。発行量の重さは、まず自分たちの社債の値段に出ている。
ここからが本題だ。年初からの金利の動きを、年限ごとに並べてみた。
| 年限・指標 | 2025年末 | 年初来の高値(終値) | 10月21日 | 年初来の変化 |
|---|
| 政策金利(上限) | 3.75% | 4.00%(9月17日〜) | 4.00% | +25bp |
| 2年債 | 3.47% | 4.92%(9月28日) | 4.81% | +134bp |
| 10年債 | 4.18% | 5.31%(10月5日) | 5.13% | +95bp |
| 30年債 | 4.84% | 5.67%(10月7日) | 5.42% | +58bp |
| 10年の期間プレミアム | 0.57% | 1.10%(10月5日) | 0.99% | +41bp |
利回りは米財務省の国債の利回り(終値)、期間プレミアムはFRBのKim-Wrightモデルの推計値で、最新は10月16日の値だ。10月7日の5.36%と5.73%は取引時間中の高値なので、表の終値とは少しずれる。
一番大きく動いたのは、2年債だった。
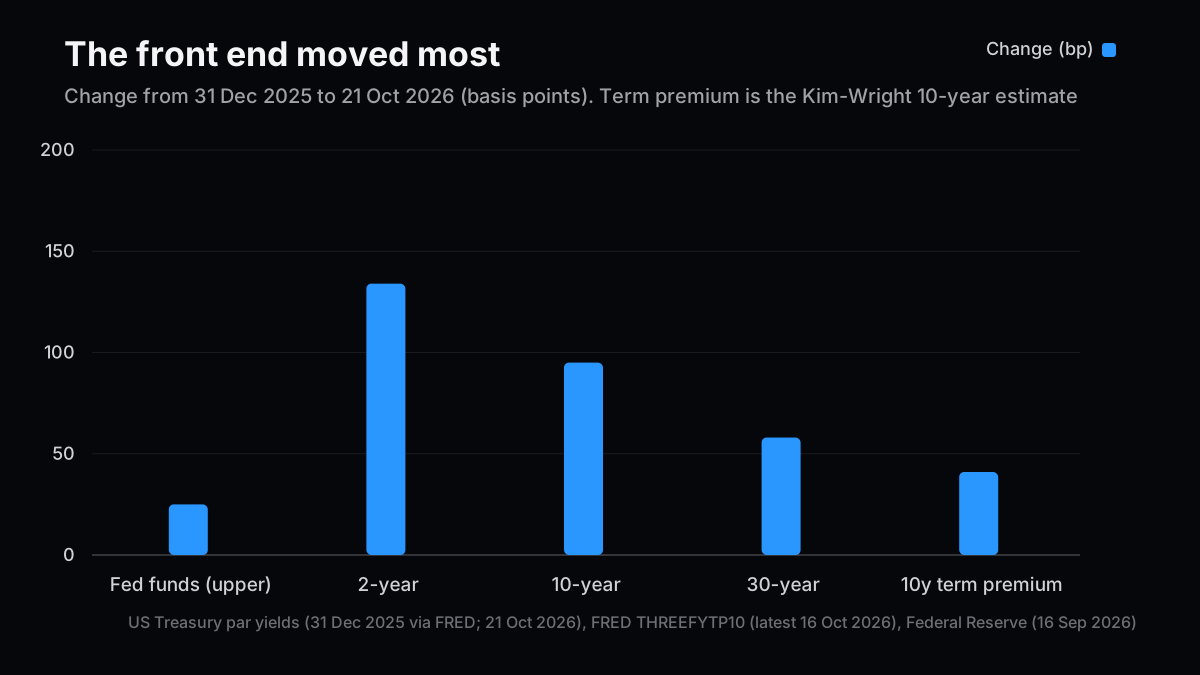
2年債は、今後2年ほどの政策金利の見通しをほぼそのまま映す。それが134bp上がり、10年債の95bpを上回った。長期金利の上昇の大半は、利上げとその先の利上げ観測で説明できる、というのが私の読みだ。
期間プレミアムは41bp上がった。長い国債を持つリスクへの上乗せで、国債の発行の多さ、海外の国債の売り、インフレの不確かさ、そして社債の長期物の供給も、ここに入ってくる。社債の発行が国債の金利に効くとしたら、この41bpの中の一部ということになる。
もう一つ、年限ごとの差も見た。
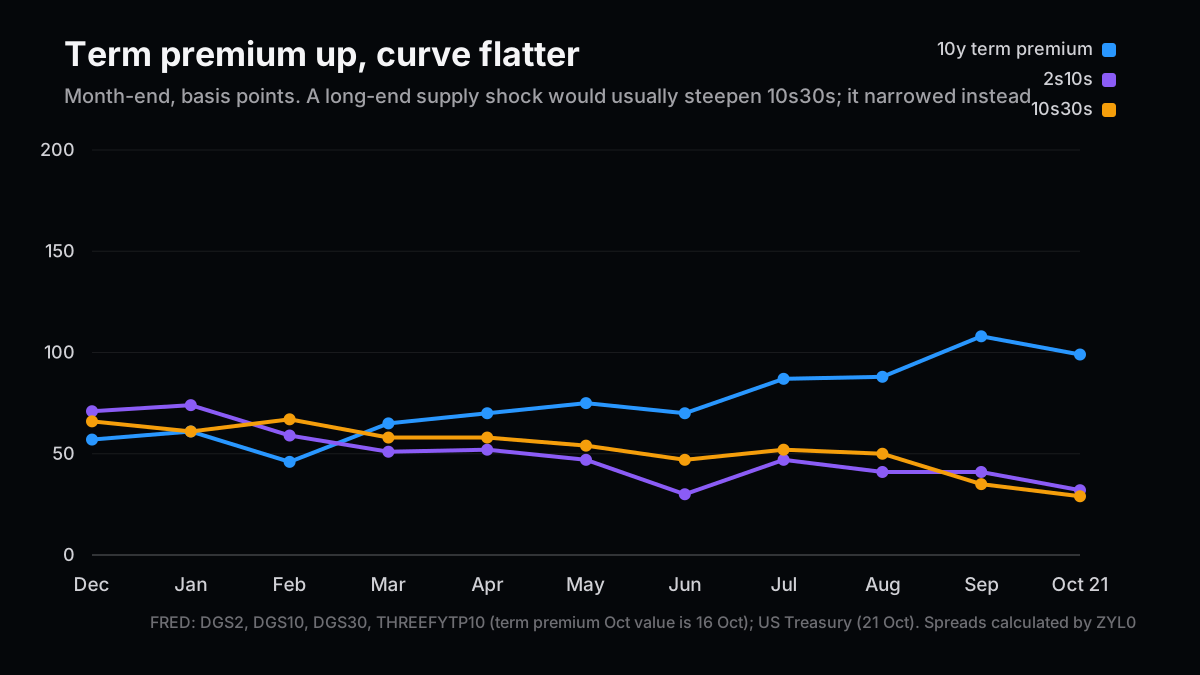
もし長期の社債が長期の国債の買い手を奪っているなら、30年債が10年債より売られ、10年と30年の差は広がるはずだ。実際には、この差は年初の66bpから29bpまで縮んだ。期間プレミアムは上がったのに、カーブは平らになっている。私はここで一度、手を止めた。長期の側にだけ供給の重しがかかっている、という絵とは合わない。
PIMCOの6月の分析も近い結論だった。2月27日からの10年債の上昇51bpのうち、38bpは政策金利の見通しの変化、13bpが期間プレミアムだったという。キャピタル・エコノミクスも、AI関連の起債だけでは国債の動きを説明できないとする見方を示したと報じられている。逆に、J.P. Morganは長期の起債が「長期金利の上昇に寄与した可能性がある」と書き、IMFもAIの借入が国債と投資家の資金を取り合うリスクを挙げた。見方は割れている。ただ、主因とまで言う資料は見つからなかった。
それでも量は無視できない。そこで、2026年1〜8月の長期の国債の入札額と比べてみた。
| 項目 | 金額 | 前提 |
|---|
| 30年債の入札(1〜8月) | 1,850億ドル | 2・5・8月は250億ドル、他の月は220億ドル |
| 20年債の入札(1〜8月) | 1,130億ドル | 2・5・8月は160億ドル、他の月は130億ドル |
| 国債の長期入札の合計 | 2,980億ドル | — |
| ハイパースケーラーのドル建て社債(〜8月20日) | 1,570億ドル | J.P. Morganの2,190億ドルからドル以外の620億ドルを除く |
| うち満期15年超 | 470億〜640億ドル | 長期の比率を30〜41%と置いた |
| 国債の長期入札に対する比率 | 約16〜22% | — |
入札の規模は財務省の発表どおり据え置かれていたものとし、比率の前提には年の違うデータが混ざるので、粗い推計だ。それでも、長期の国債入札の5分の1前後という量は、小さくない。長期の債券を買う資金の取り合いが起きていても不思議はない。
ただ、それが国債の金利にどれだけ出たかは、上のカーブの形を見る限り限られている。量の重さを一番受けているのは、国債ではなく、発行した会社自身の社債の値段だ。私の結論は、ここに落ち着いた。
国債から一段ずつ信用の低い借り手へ降りていくと、景色が変わる。
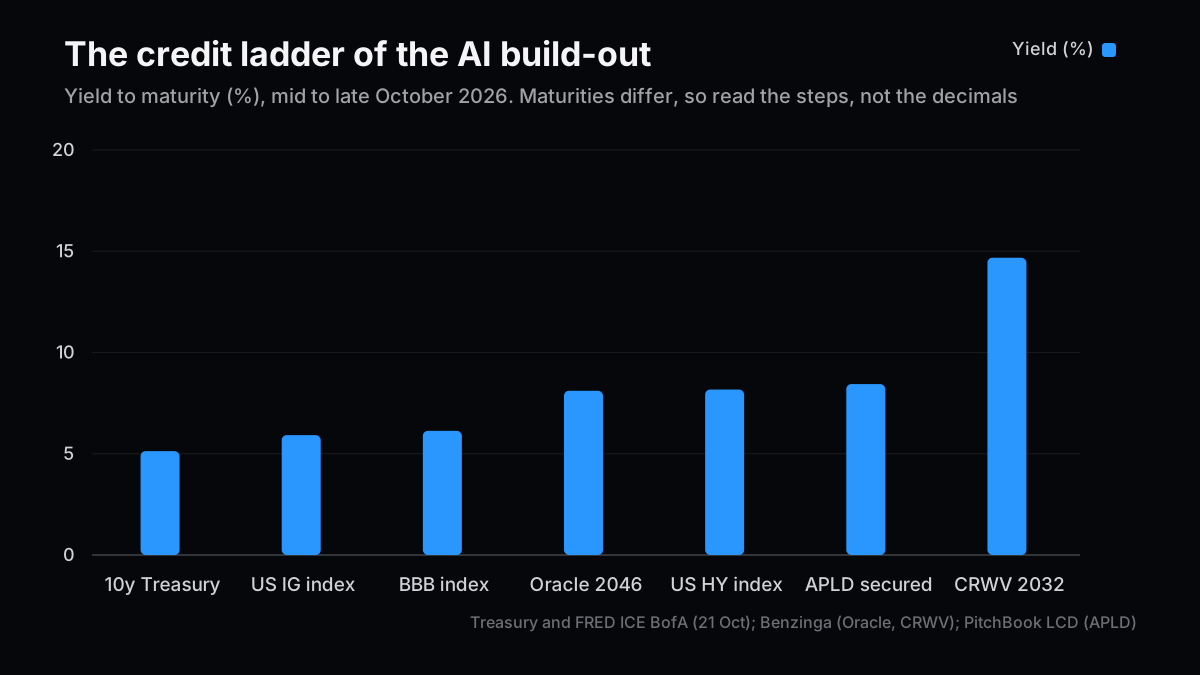
10年の国債が5.13%、投資適格の社債全体が5.92%、BBBの社債が6.13%。ここまでは0.2〜0.8%ずつの緩い階段だ。その上に、Oracleの2046年満期債が8.11%で乗っている。Oracleは7月9日にS&PからBBB−に格下げされ、投資適格の一番下にいる。満期が長いので単純には比べられないが、この利回りはハイイールド社債の指数(8.17%)とほとんど同じだ。投資適格のまま、値段はもうジャンク債に近い。
そしてCoreWeaveの2032年満期債が14.68%(10月21日)。階段はここで一段どころか、壁のように跳ね上がる。

一つ、言葉を正しておきたい。CoreWeaveの社債が「ジャンク債に落ちた」わけではない。もともと格付けは投資適格の下、つまりハイイールド債として出ている。この1か月で起きたのは格下げではなく、値段の急落だ。PitchBookのLCDによれば、9.75%の2031年満期債は10月14日に額面100に対して78まで下がり、利回りは16.39%をつけた。月初は85前後だった。Bloombergによれば、5年のCDS(債務不履行に備える保険料)は10月15日に取引時間中で1,194.5bpの過去最高となり、5年以内の債務不履行の確率を60%超と織り込んだ。その後、19日には1,090bp前後まで戻っている。
ネオクラウドと、その周りのデータセンター開発会社を並べると、資金の集め方がはっきり分かれる。
| 企業 | 主な資金調達(2025〜26年) | 10月中旬の市場のサイン |
|---|
| CoreWeave(CRWV) | 無担保のハイイールド債(9.75% 2031年、9.625% 2032年など)。4〜6月期に無担保債と転換社債で100億ドル超、タームローン31億ドル | 2031年債は78〜82、利回り15〜16%台。5年CDSは1,000bp超 |
| Nebius(NBIS) | 転換社債。3月に40億ドル(1.25% 2031年、2.625% 2033年)、8月に57.5億ドル(0.50% 2030年、4.50% 2034年) | 低いクーポンで発行できている。株価の期待で資金を集める形 |
| Applied Digital(APLD) | 担保付きのプロジェクト債(9.25% 2030年 23.5億ドル、6月に7% 5年債 15.9億ドル)。主な借り手はCoreWeave | 7%債は94.5、利回り約8.44%。J.P. Morganのアナリストが推奨を中立に下げた |
| TeraWulf(WULF) | 担保付き債(7.75% 2030年 32億ドル、2025年10月)。Googleが借り手の賃料の一部を保証 | 足元の価格は確認できなかった |
表を作って気づいたことが2つある。
1つ目は、同じAIインフラでも、借り方で値段がまるで違うことだ。Applied Digitalの担保付き債の利回りは8%台にとどまる。その借り手はCoreWeaveなのに、CoreWeave自身の無担保債は15%前後だ。データセンターという実物と、長期の賃貸契約を担保に取っている債券は、会社全体の信用よりも守られていると市場は見ている。
2つ目は、Nebiusが転換社債に寄せていることだ。0.50%というクーポンは、株価が上がれば株に換えられる権利の対価だ。株価が下がれば、ただの低クーポンの借金が残る。信用の問題を、株価の問題に置き換えた形とも言える。
CoreWeaveの4〜6月期の決算を見ると、問題は売上ではない。売上は前年同期の2.1倍の25.75億ドル、受注残は約1,040億ドルに達した。7〜9月期の初めには、さらに250億ドル超の新規契約を積んだという。
重いのは金利だ。4〜6月期の純支払利息は6.4億ドルで、前年同期の2.7億ドルの2倍を超えた。調整後のEBITDA(15.1億ドル)に対しては2.4倍の余裕があるが、減価償却を引いた調整後の営業利益(1.28億ドル)では、利息の5分の1しか賄えない。借入とリース債務を合わせると、約510億ドルに達したと報じられている。
ここで、簡単な計算をしてみた。新たに100億ドルを借りるとする。クーポン9.75%なら年間の利息は9.75億ドル、15%なら15億ドルだ。差は年5.25億ドルで、4〜6月期の調整後営業利益の4四半期分(約5.1億ドル)とほぼ同じになる。2026年の設備投資の計画は350億〜390億ドルと報じられている。成長を続けるには借り続けるしかないが、借りるたびに、稼いだ利益が金利に消えていく。
ディープテックの投資を20社以上実行してきて、私は設備の重い会社ほど「次の資金をどの条件で集められるか」で価値が変わるのを見てきた。追加出資の案件で、バリュエーションの過大評価に気づき、データを持って反対し、条件の交渉を主導したこともある。事業計画の数字がどれほど良くても、その計画を回すための資金の値段が変われば、同じ計画の価値は変わる。CoreWeaveの株価が大きく下げているのも、売上ではなく、この資金の値段を見ているからだと思う。
ハイパースケーラーにとって、ネオクラウドは計算資源の仕入れ先であり、同時に自分たちが出資や契約で支えている相手でもある。IMFは、2023年以降に公表された14件のAI案件で、ハイパースケーラーが約3,000億ドルの株式と約6,500億ドルの融資を出し、約1.4兆ドルの将来の支出の約束を得ていると分析したと報じられている。収入が細ったとき、出資の価値も同時に下がる。IMFはこれを「誤った方向のリスク(wrong-way risk)」と呼んだ。
Oracleについては、S&Pが格下げの理由として、受注残約6,380億ドルの約半分をOpenAIが占める顧客の集中を挙げたと報じられている。ハイパースケーラーの社債の上乗せ金利が年初から広がっているのは、発行量の多さだけでなく、こうした取引相手の信用も値段に入り始めたからだと私は見ている。
ここまでを、今後6〜12か月の3つのシナリオに置き直す。確率は私の主観だ。
| シナリオ | 確率 | 何が起きるか | 先に出る兆候 |
|---|
| ベースケース | 50% | 政策金利は4%前後で止まり、10年債は5%前後で高止まり。ハイパースケーラーは起債を続け、上乗せ金利はじわじわ広がる。ネオクラウドは高い金利でも、私募や保険会社の資金で調達をつなぐ | 10月のFOMCは据え置き。CoreWeave債の利回りが13〜16%の範囲にとどまる |
| メインシナリオ(上振れ) | 20% | インフレの鈍化で利下げの見方が戻り、長期金利が4%台後半へ下がる。ネオクラウドが12%未満で借りられるようになり、信用の階段が低くなる | 2年債が4.5%を割る。ネオクラウドの新しい社債が順調に売れる |
| テールリスク | 30% | ネオクラウドの調達の窓が閉じ、データセンターのハイイールド債とOracleに波及する。ハイパースケーラーは設備投資を絞り、国債は逆に安全資産として買われて利回りが下がる | CoreWeaveのCDSが1,500bpを超える。Oracleがハイイールドに格下げされる。新しい社債の発行が取り下げられる |
テールリスクを30%と高めに置いたのは、今の値段がすでにその可能性を半分近く織り込んでいるからだ。CDSの60%という数字は、市場がそれだけ真剣に見ているというサインだと受け取っている。
注意したいのは、テールリスクの側では国債の利回りが下がることだ。「AIの借金が金利を押し上げる」という筋書きが一番当たるのは、AI投資がうまく回っているときだ。崩れるときは、お金は国債へ逃げる。
- 米国の長期国債:中立。 年初からの上昇は利上げが主導していて、起債が主因とは見ていない。テールリスクでは国債が逃げ場になる
- 高格付けのハイパースケーラー債(Alphabet・Amazon・Meta・Microsoft):中期でロング寄り。 年初から広がった上乗せ金利は、発行量の多さに対する対価として取りに行ける
- Oracleの社債:様子見。 BBB−で、あと1段下がればハイイールドになる。長期債の利回りはすでにハイイールドの指数並みだ
- ネオクラウドの無担保債と株:短期はネガティブ。 CDSが1,000bpを超えている間は、株も信用の動きに引っ張られる
- 担保付きのデータセンター債:選別。 借り手の信用と担保の質で差がつく。同じ8%台でも中身は違う
2つある。1つ目は、2年債が下がるのに30年債が上がり、10年と30年の差が急に広がる場合だ。しかも、ハイパースケーラーの大型起債の日に国債が売られる、ということが何度も続く。そうなれば、供給の重しが国債の金利に直接効いていると認めて、私は見方を改める。
2つ目は、CoreWeaveなどのネオクラウドが、12%未満の利回りで大きな資金調達を終えた場合だ。調達の窓が開いていると分かれば、信用ストレスの見立ては外れたことになる。
- 10月27〜28日のFOMCの決定と声明
- 11月初めの財務省の四半期定例入札の発表で、長期債の入札額が増えるか
- 11月のネオクラウドの7〜9月期決算での利息、調達計画、受注残
- Oracleの格付け(S&PはBBB−、Moody'sはBaa2で見通しはネガティブ)
- ハイパースケーラーの次の大型起債で、新しい社債の上乗せが広がるか
書き終えて、一つだけ迷いが残っている。期間プレミアムの41bpのうち、社債の分がいくらなのかを、私はまだ数字で切り分けられていない。それが分かるまで、この結論は暫定だと思っている。
次号の記事案
- 案1:社債に出ない借入を数える — J.P. Morganは、データセンターのリース債務を約1.4兆ドル、うち約1.1兆ドルがバランスシートの外にあると推計している。各社の開示から積み上げ、社債の数字に出ない借入の重さを測る。
- 案2:保険マネーはAIインフラの最後の貸し手になるか — ネオクラウドが頼り始めた保険会社や私募の資金を、利回りと担保の条件で比べる。テールリスクの入り口がどこにあるかを確かめる回。
- 案3:11月の定例入札で、長期債の入札額は増えるか — 財務省の発行計画と期間プレミアムの関係を、本稿の分解の続きとして追う。2027年に入札額が増えるという見方が早まるかが焦点。
本稿は投資助言ではありません。記載した企業の有価証券を筆者が保有している可能性があります。作成には生成AIを利用しています。投資判断の前に免責事項をご確認ください。
Did the AI Bond Rush Push Up Long-Term US Yields? Hyperscaler Issuance and Neocloud Credit Stress
This is an outside-in read based only on public information. I did not interview any company or use non-public material. Bond prices and yields come from news reports or public data unless noted.
On October 7, the 10-year Treasury yield touched 5.36% and the 30-year hit 5.73%, both the highest since 2002. A week later, bonds issued by the AI cloud provider CoreWeave fell below 80 cents on the dollar and yielded more than 15%.
Put those two numbers side by side and a story writes itself. Hyperscalers sold a mountain of bonds to pay for AI, the weight of that supply lifted long-term rates, and credit is now cracking at the weakest borrower.
It hangs together. I still wanted to take it apart with numbers before I believed it.
In September's piece on rate risk and tech capex, I wrote that a rate hike would make me more worried about a capex slowdown. The hike came on September 16: the Fed raised its target range by a quarter point to 3.75–4.00%, on a 12–0 vote. Capex plans did not shrink. If anything, the view that the four largest spenders will pass $1 trillion combined in 2027 has firmed. The pressure showed up somewhere other than where I expected.
My last post, on certification gates for 800V DC data centers, was about the permits needed to switch power on inside the building. This one is about the money that builds the building.
The short version: what stands out about hyperscaler issuance is not just its size but how long it runs.
J.P. Morgan Asset Management counted $219 billion of investment-grade bonds sold by Alphabet, Amazon, Meta, Microsoft and Oracle in 2026 as of August 20, including about $62 billion in currencies other than the dollar. It expects their share of US dollar investment-grade issuance to reach 9% this year, up from 2% across 2022–24. The IMF's October 13 Global Financial Stability Report reportedly put their share of global investment-grade issuance at about 10% in 2026, against less than 1% in 2024.
The headline deals tell the story:
| Issuer | When | Size | Longest maturity | Terms |
|---|
| Oracle | Feb 2026 | $20–25bn in eight tranches | Not disclosed | 10-year at Treasuries +145bp; record order book near $129bn |
| Alphabet | Feb 2026 | About $32bn equivalent, several currencies | 100 years (sterling) | £1bn century bond drew £9.5bn of orders at gilts +120bp |
| Amazon | Mar 2026 | $37bn in 11 tranches, plus €14.5bn | 50 years (2076) | Longest bond at Treasuries +130bp; about $126bn of orders |
| Meta | Apr 2026 | $20–25bn planned, up to six tranches | 40 years (2066) | Initial talk up to Treasuries +180bp |
| Microsoft | — | No large 2026 deal found | — | Funds most of its spending from operating cash flow |
What caught my eye was the maturity profile. TwentyFour Asset Management estimated on September 3 that 41% of hyperscaler issuance across 2025 and 2026 runs past 15 years, against 16% for the broad corporate index. PIMCO's June 1 count showed hyperscalers taking about 13% of 10-year investment-grade supply through May (roughly $21 billion) and more than 30% of 30-year supply (roughly $32 billion).
Long corporate bonds compete for the same wallets as long Treasuries: life insurers and pension funds. So the idea that this borrowing pushed long rates up has a real mechanism behind it.
The pricing, though, points somewhere else. J.P. Morgan says hyperscaler spreads have widened about 30 basis points this year while the broad investment-grade index moved just 2. The weight of all that supply shows up first in the price of their own bonds.
This is the core of the piece. I lined up the move since the start of the year, maturity by maturity:
| Rate | End of 2025 | 2026 closing high | Oct 21 | Change YTD |
|---|
| Fed funds (upper bound) | 3.75% | 4.00% (since Sep 17) | 4.00% | +25bp |
| 2-year Treasury | 3.47% | 4.92% (Sep 28) | 4.81% | +134bp |
| 10-year Treasury | 4.18% | 5.31% (Oct 5) | 5.13% | +95bp |
| 30-year Treasury | 4.84% | 5.67% (Oct 7) | 5.42% | +58bp |
| 10-year term premium | 0.57% | 1.10% (Oct 5) | 0.99% | +41bp |
Yields are US Treasury closing par yields. The term premium is the Fed's Kim-Wright estimate, latest as of October 16. The 5.36% and 5.73% prints on October 7 were intraday highs, which is why they sit above the closing numbers here.
The biggest mover was the 2-year.
The 2-year mostly reflects where the market thinks the policy rate will go over the next couple of years. It rose 134 basis points, more than the 10-year's 95. My read is that most of the rise in long yields comes from the hike and the expectation of more.
The term premium rose 41 basis points. That is the extra pay for holding long-dated debt, and it absorbs heavy Treasury supply, selling of other governments' bonds, inflation uncertainty and, yes, the supply of long corporate bonds. If corporate issuance is moving Treasury yields, it lives somewhere inside those 41 basis points.
I also looked at the gaps between maturities.
If long corporate bonds were crowding buyers out of long Treasuries, I would expect the 30-year to cheapen against the 10-year and the 10s30s spread to widen. It did the opposite, narrowing from 66 basis points at the start of the year to 29. The term premium went up, yet the curve got flatter. I stopped here for a while. It does not fit a picture where supply is weighing on the long end alone.
PIMCO reached a similar conclusion in June. Of the 51-basis-point rise in the 10-year from February 27, it attributed 38 to changing policy expectations and 13 to the term premium. Capital Economics has reportedly argued that AI bond issuance alone cannot explain the Treasury move. On the other side, J.P. Morgan wrote that long-end issuance "may also have contributed" to higher long yields, and the IMF flagged AI borrowing competing with sovereign bonds for investors. Opinion is split. What I could not find was anyone credible calling it the main driver.
The volume still deserves respect, so I compared it with long Treasury auctions from January through August 2026.
| Item | Amount | Assumption |
|---|
| 30-year auctions (Jan–Aug) | $185bn | $25bn in Feb, May, Aug; $22bn in other months |
| 20-year auctions (Jan–Aug) | $113bn | $16bn in Feb, May, Aug; $13bn in other months |
| Total long Treasury auctions | $298bn | — |
| Hyperscaler dollar bonds (to Aug 20) | $157bn | J.P. Morgan's $219bn minus $62bn in other currencies |
| Of which longer than 15 years | $47–64bn | Long share assumed at 30–41% |
| Share of long Treasury auctions | About 16–22% | — |
This assumes auction sizes stayed where the Treasury said they would, and it mixes data from different windows, so treat it as rough. Even so, roughly a fifth of long Treasury auction volume is not small. A tug-of-war for long-duration money would not surprise me.
How much of it reached Treasury yields is another matter. Judging by the shape of the curve, not much. The party taking the most strain is not the Treasury market. It is the issuers' own bonds. That is where I landed.
Walk down the credit ladder one step at a time and the view changes.
The 10-year Treasury sits at 5.13%, the investment-grade index at 5.92% and the BBB index at 6.13%. Those are gentle steps of 0.2 to 0.8 points. Then comes Oracle's 2046 bond at 8.11%. S&P cut Oracle to BBB− on July 9, the bottom rung of investment grade. The maturities differ, so the comparison is loose, but that yield is almost identical to the high-yield index at 8.17%. Oracle is still investment grade on paper and already priced close to junk.
Then CoreWeave's 2032 bond, at 14.68% on October 21. Here the ladder stops being a ladder and turns into a wall.
One correction to the way this is often described. CoreWeave's bonds did not "fall to junk." They were sold as high-yield bonds from the start, rated below investment grade. What happened this month was not a downgrade but a price collapse. According to PitchBook LCD, the 9.75% notes due 2031 traded as low as 78 on October 14 for a 16.39% yield, down from about 85 at the start of the month. Bloomberg reported that five-year credit default swaps hit a record 1,194.5 basis points intraday on October 15, pricing more than a 60% chance of default within five years. By October 19 they had eased to around 1,090.
Lay the neoclouds and their data-center developers side by side and their funding styles split clearly.
| Company | Main funding, 2025–26 | Market signal, mid-October |
|---|
| CoreWeave (CRWV) | Unsecured high-yield bonds (9.75% 2031, 9.625% 2032 and others). Over $10bn of unsecured and convertible debt plus a $3.1bn term loan in Q2 | 2031s at 78–82, yields in the mid-teens; five-year CDS above 1,000bp |
| Nebius (NBIS) | Convertibles: $4bn in March (1.25% 2031, 2.625% 2033) and $5.75bn in August (0.50% 2030, 4.50% 2034) | Still able to issue at low coupons, funding on equity upside |
| Applied Digital (APLD) | Secured project bonds ($2.35bn of 9.25% 2030s; $1.59bn of 7% five-year notes in June). Main tenant is CoreWeave | 7% notes at 94.5, about 8.44%; J.P. Morgan analysts cut them to Neutral |
| TeraWulf (WULF) | Secured notes ($3.2bn of 7.75% 2030s, October 2025). Google backstops part of its tenant's lease | I could not confirm a current price |
Two things jumped out when I built this table.
First, the same AI infrastructure prices very differently depending on how the debt is structured. Applied Digital's secured bonds yield around 8%, and its tenant is CoreWeave, whose own unsecured bonds yield around 15%. The market treats bonds backed by a physical data center and a long lease as safer than the tenant's general credit.
Second, Nebius has leaned on convertibles. A 0.50% coupon is what you pay when buyers get the right to swap into shares if the stock rises. If the stock falls, a cheap loan is all that is left. It turns a credit question into an equity question.
CoreWeave's second-quarter results show that revenue is not the problem. Revenue more than doubled from a year earlier to $2.575 billion, and the backlog reached about $104 billion, with more than $25 billion of new commitments added early in the third quarter.
Interest is the problem. Net interest expense was $640 million in the quarter, more than double the $267 million a year earlier. Adjusted EBITDA of $1.51 billion covers that 2.4 times. Adjusted operating income, after depreciation, was $128 million, which covers only about a fifth of it. Debt and lease obligations together are reported at about $51 billion.
So I did a simple calculation. Say the company borrows another $10 billion. At a 9.75% coupon that costs $975 million a year in interest. At 15% it costs $1.5 billion. The gap, $525 million a year, is about the same as four quarters of second-quarter adjusted operating income (roughly $510 million). Capex plans for 2026 have been reported at $35–39 billion. To keep growing it has to keep borrowing, and every new loan hands more of its operating profit to lenders.
Having made more than 20 deep-tech investments, I have watched again and again how the value of a capital-heavy company turns on the terms of its next raise. On one follow-on round I spotted that the valuation was overstated, argued against it with data, and led the renegotiation. However good the business plan looks, if the price of the money needed to run it changes, the plan is worth something different. I think that is what CoreWeave's share price is reacting to: not revenue, but the price of money.
For the hyperscalers, the neoclouds are suppliers of compute and also counterparties they prop up with equity and contracts. The IMF reportedly reviewed 14 publicly disclosed AI deals since 2023 in which hyperscalers put in about $300 billion of equity and about $650 billion of debt in exchange for roughly $1.4 trillion of future spending commitments. When revenue dries up, those investments lose value at the same moment. The IMF called this wrong-way risk.
For Oracle, S&P reportedly cited customer concentration as a reason for the downgrade, with OpenAI accounting for about half of a roughly $638 billion backlog. My read is that hyperscaler spreads have widened this year not just because of supply, but because counterparty credit is starting to show up in the price.
Here is how I would frame the next six to twelve months. The probabilities are my own judgment.
| Scenario | Probability | What happens | Early signals |
|---|
| Base case | 50% | The policy rate holds near 4% and the 10-year stays around 5%. Hyperscalers keep issuing and spreads drift wider. Neoclouds keep funding through private deals and insurer money, at high rates | The Fed holds in October; CoreWeave bonds stay in a 13–16% yield range |
| Main scenario (upside) | 20% | Softer inflation revives rate-cut bets and long yields slip into the high 4s. Neoclouds can borrow below 12% and the credit ladder flattens | The 2-year breaks below 4.5%; new neocloud bonds sell smoothly |
| Tail risk | 30% | The funding window shuts for neoclouds and stress spreads to data-center high yield and Oracle. Hyperscalers trim capex, and Treasuries rally as a safe haven | CoreWeave CDS above 1,500bp; Oracle cut to high yield; new bond deals pulled |
I put the tail at 30% because prices already lean that way. A 60% implied default probability in the CDS tells me the market is taking it seriously.
One thing worth noticing: in the tail, Treasury yields fall. The "AI debt drives rates up" story fits best while AI investment is working. When it breaks, money runs to Treasuries.
- Long Treasuries: neutral. This year's rise has been led by the Fed, not by issuance, and Treasuries become the refuge in the tail scenario
- High-grade hyperscaler bonds (Alphabet, Amazon, Meta, Microsoft): leaning long over the medium term. The spread widening this year is compensation for heavy supply, and I would take it
- Oracle bonds: wait and see. At BBB−, one more notch puts them in high yield, and the long bonds already yield about the same as the high-yield index
- Neocloud unsecured bonds and shares: negative in the short term. As long as CDS sits above 1,000 basis points, the shares will follow credit
- Secured data-center bonds: selective. Tenant credit and collateral quality make the difference; two 8% yields can hide very different risks
Two things. First, if the 2-year falls while the 30-year rises and the 10s30s spread widens sharply, and if Treasuries sell off repeatedly on the days hyperscalers launch big deals, I will accept that supply is hitting Treasury yields directly and revise this view.
Second, if CoreWeave or another neocloud completes a large raise at a yield below 12%, the funding window is open and my credit-stress read is wrong.
- The Fed's decision and statement on October 27–28
- Whether the Treasury's quarterly refunding announcement in early November raises long-bond auction sizes
- Interest costs, funding plans and backlog in the neoclouds' third-quarter results in November
- Oracle's ratings (BBB− at S&P; Baa2 with a negative outlook at Moody's)
- Whether the next big hyperscaler deal has to pay a wider new-issue premium
One doubt stays with me after writing this. I still cannot split the 41-basis-point rise in the term premium into a corporate-supply piece and everything else. Until I can, I hold this conclusion provisionally.
- Federal Reserve issues FOMC statement (Federal Reserve, September 16, 2026)
- Daily Treasury Par Yield Curve Rates, October 2026 (US Treasury)
- Hyperscalers: Now also a credit story (J.P. Morgan Asset Management, August 20, 2026)
- AI financing needs do not override cyclical drivers of yield (PIMCO, June 1, 2026)
- How hyperscaler issuance is reshaping the Treasury curve (TwentyFour Asset Management, September 3, 2026)
- CoreWeave Reports Strong Second Quarter 2026 Results (CoreWeave, August 11, 2026)
Next Issue Ideas
- Idea 1: Counting the borrowing that never shows up as bonds — J.P. Morgan estimates about $1.4 trillion of data-center lease obligations, roughly $1.1 trillion of them off balance sheet. Building that number up from company filings would show how much leverage sits outside the bond tallies.
- Idea 2: Will insurers become the lender of last resort for AI infrastructure? — Compare the yields and collateral terms of the insurer and private-credit money that neoclouds have started to court, and find where the tail risk would actually start.
- Idea 3: Will November's refunding raise long-bond auction sizes? — Follow the link between Treasury's issuance plan and the term premium as a sequel to this breakdown. The question is whether the expected 2027 increase in auction sizes gets pulled forward.
This post is not investment advice. The author may hold securities of the companies mentioned. Generative AI was used in preparing it. Please read the disclaimer before making any investment decision.