Japan Shipped Fewer Chips in October: Value Up 50%, Units Down 8.5%. Is It a Turning Point? 20 Years of Trade Data (November 2026)
Japan's October IC exports rose 50.2% in yen but fell 8.5% in units, after units grew 10.2% in January-September. Twenty years of customs data split value, units and unit price to test whether one preliminary month marks a turning point.
Japan's October IC exports rose 50.2% in yen but fell 8.5% in units, after units grew 10.2% in January-September. Twenty years of customs data split value, units and unit price to test whether one preliminary month marks a turning point.
Japan's integrated-circuit exports rose 50.2% year on year in yen in October, to ¥708.2 billion, while the number of chips shipped fell 8.5%, to 6.81 billion units. Through January–September, units had grown 10.2%, with nine straight months above the prior year. The decline rests on a single month of preliminary data released on November 18, so I am not calling it a turning point yet. I call it the "entry to a turning point" when IC units excluding China fall year on year for two months in a row and, in both of the same two months, memory unit value's year-on-year rate is below the prior month's (unit-value growth slows), and a "demand pullback" when memory unit value itself falls year on year. The price condition is easy to meet while last year's level keeps rising, so the real trigger is units excluding China.
The stock market moved first, which is why I went looking. The S&P 500 fell 8.6% in the week to November 20, and fund managers cut their technology exposure by the most since 2006. The reason given in press coverage and the survey is an expected slowdown in AI capital spending. Whether that shows up in real demand cannot be read from prices alone or from quantities alone; it takes both directions together. Japan's customs data report ICs in units and value, and chipmaking tools in machines and value, every month.
This post relies only on published statistics and press reports. It is about supply and demand in export value, units and unit price, not an assessment of any single company.
Money left tech, but it did not go to cash
On Friday, November 20, the S&P 500 dropped 3.7% in a day to close at 6,910.39. That made the week -8.6% and put the index more than 10% below its October 6 record close of 7,818.93, in correction territory.
The positioning shift shows up in BofA's November Global Fund Manager Survey, published November 17. The survey itself is not public, so the table below carries only figures I confirmed in a Reuters wire story and two detailed write-ups.
| Item (BofA FMS, November 2026) | Value | Prior / comparison |
|---|---|---|
| Net overweight in technology | 12% | 37% in October; biggest monthly cut since June 2006 |
| Average cash holdings | 3.6% | 3.9% in October; lowest since August |
| Share saying companies overinvest | Net 38% | A record |
| Share expecting AI hyperscalers to announce capex cuts within six months | 52% | — |
| Share expecting a recession | 3% | — |
Cash stayed low, the bond underweight shrank to its smallest since November 2025, and weight moved from technology to bonds, consumer stocks and healthcare. Few expect a recession. In the survey, the worry is aimed at AI capital spending, not at the economy as a whole.
In my last post on year-end seasonality, I wrote that a broad market decline should be separated from calendar effects and traced to whatever actually moved prices, such as rates or earnings. This time the candidate being cited is AI capital spending.
Splitting 20 years of trade data into value, units and unit price
The source is the Ministry of Finance's commodity-by-commodity trade series (exports, nationwide, monthly), using final data from January 2006 through September 2026. I define ICs as HS 8542.31/32/33/39. That total matches the ministry's summary "IC" line exactly (both show 40.788 billion units and ¥3.0936 trillion for the first half of 2026), so the IC line in the October preliminary release can be attached as a continuation of the same series.
Start with January–September 2026 against the same period a year earlier.
| Jan–Sep 2026 vs 2025 | Units / machines | Value (nominal yen) | Average unit value |
|---|---|---|---|
| All ICs | +10.2% (60.5bn units) | +49.3% (¥5.1846tn) | +35.5% (¥63.2 → ¥85.7) |
| Memory (8542.32) | +9.1% | +99.0% (¥2.9864tn) | +82.4% (¥593) |
| Unmounted memory (8542.32-100) | +7.9% | +54.8% (¥1.7786tn) | +43.5% |
| Mounted flash memory (8542.32-921) | +26.0% | +263.0% (¥1.1616tn) | +188.0% |
| Processors (8542.31) | +27.0% | -0.7% | -21.8% |
| Discrete semiconductors (8541) | +10.1% | +26.8% | +15.1% |
| Chipmaking tools (8486.10/20/40, machines) | +14.5% (55,063) | +18.4% (¥2.9374tn) | +3.3% |
| Test and inspection tools (9030.82, 9031.41) | +4.8% | +41.4% (¥537.8bn) | +34.8% |
Reading this as "value is all price, volume is flat" gets January–September wrong: volume grew too. Memory produced 42.8 of the 49.3 points of IC value growth. Processors shipped 27.0% more units for flat value, as average unit value fell by a fifth. Split across six nine-digit codes, that -21.8% breaks into -3.6% from like-for-like price and -18.9% from mix: cheaper products took a larger share, rather than processor prices collapsing.
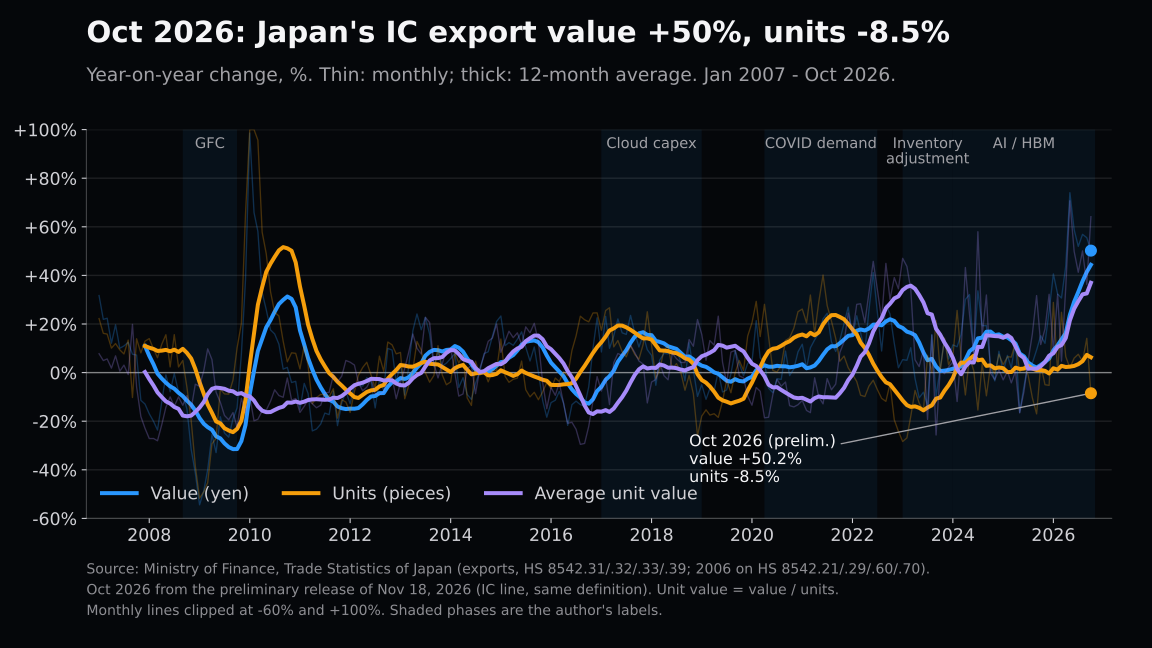
On Figure 1's thick 12-month averages, units (orange) have stayed roughly between 0% and +10% since 2024, while value (blue) and unit value (purple) took off from late 2025.
IC export value for January–September alone, ¥5.1846 trillion, already exceeds every previous full calendar year; the prior high was ¥4.8696 trillion in 2025. Units for January–September are about 7% below the same months of 2021 (65.0 billion); only value set a record.
The unit-value jump is price, not a shift between product codes
Did average unit value rise 35.5% because expensive products took a larger share, or because the same products got more expensive? Without that split, there is no way to judge what happens to value when volume falls.
When I designed devices and processes with TCAD, I once narrowed a yield problem that had been written off as "an equipment issue" down to process conditions through simulation. The first plausible explanation fell apart once the variables were separated. So I started here by doubting the obvious story: that the mix had shifted toward high-priced parts such as HBM.
A Fisher index, weighting each nine-digit code's unit-value change by quantity, splits the +35.5% into +36.3% from like-for-like price increases and -0.6% from changes in product mix. Memory units grew at about the same pace as all ICs (+9.1%). Memory's share of IC value climbed from 43.2% to 57.6% because of price. One caveat: shifts inside a single nine-digit code, such as more high-capacity parts under the same code, land on the price side of this split.
Memory, processors and discrete devices
In September, the latest month with final data, memory units rose 10.8% while value rose 136.9%, a unit-value gain of 113.8%. That year-on-year rate eased slightly from +117.8% in August, but the level still rose 9.2% from the prior month.
Discrete semiconductors (HS 8541) fell from 162–238 billion units a year in 2006–2018 to 113–125 billion in 2023–2025, while average unit value roughly doubled, from ¥4.8 in 2006 to ¥9.5 in January–September 2026. The +15.1% rise for January–September splits into +21.9% from price and -5.5% from mix. This data cannot say why the line shifted to "fewer and pricier," so I do not use it in my call.
What Korea's primary data show on prices
The same memory story appears in Korea. According to Korea's Ministry of Trade, Industry and Resources, semiconductor exports hit a monthly record of $60.30 billion in September (+262.8%) and the second-highest month, $56.44 billion, in October (+259.4%). The same releases list fixed prices for representative DRAM and NAND products (DDR5 16Gb and NAND 128Gb as of October 2026).
| Month (2026) | DDR5 16Gb (US$) | NAND 128Gb (US$) |
|---|---|---|
| June | 40.0 | 28.8 |
| July | 45.0 | 30.1 |
| August | 46.5 | 30.5 |
| September | 48.0 | 30.6 |
| October | 50.0 | 30.6 |
DRAM kept rising in October; NAND has been flat since September. The ministry's text says high prices and volumes were maintained, but the text of its releases gives no figures for semiconductor export quantities. In Japan's exports, like-for-like price increases drove unit value higher, and Korean fixed prices rose too. That reads as a market-wide rise in memory prices rather than a mix shift between codes specific to Japan. This post does not establish what caused it.
October's decline came mostly from shipments to China
In the October preliminary release, world IC exports were 6,810 million units (-8.5%) and ¥708.2 billion (+50.2%), for an average unit value of about ¥104, up roughly 64% year on year (my calculation, value divided by units). At the world level, value growth has not broken.
Broken down by destination, the unit decline is lopsided.
| October ICs (preliminary, y/y) | Units | Value |
|---|---|---|
| World | -8.5% | +50.2% |
| China | -29.4% | -9.1% |
| South Korea | -23.9% | +3.3% |
| Asia total | -9.1% | +51.0% |
| ASEAN | +12.8% | +153.9% |
| EU | +6.2% | +14.0% |
| United States | +23.0% | +44.2% |
Converting back to prior-year unit counts, shipments to China fell by about 1.0 billion units, more than the world total decline of about 630 million (my calculation). ASEAN rose by about 240 million units and Korea fell by about 70 million. IC units excluding China rose about 9.7% (my calculation: 4,365 million versus 3,980 million a year earlier). With the US up as well, Korea's drop leaves no decline beyond China in aggregate.
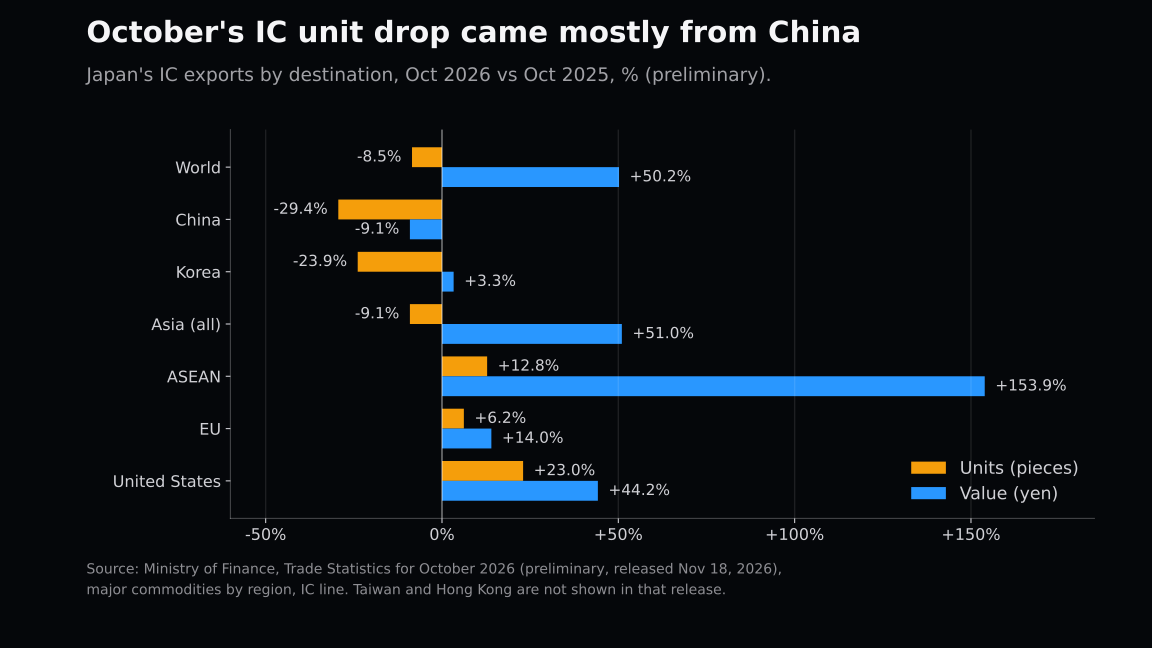
China hits units hard and value lightly because the chips it buys from Japan are cheap. October's average unit value for China was about ¥34, roughly a third of the world average of about ¥104 (my calculation). Over January–September, China took 38.7% of units but only 24.1% of value. Setting China against units excluding China is meant to separate weak demand for general-purpose ICs beyond AI from something specific to China. The link between cheap ICs shipped to China and AI capital spending cannot be verified from these statistics.
For China, value slowed in September and units in October.
| 2026, ICs to China | Units (y/y) | Value (y/y) |
|---|---|---|
| January | +33.4% | +48.0% |
| February | +6.6% | +62.4% |
| March | +50.0% | +52.8% |
| April | -6.4% | +121.6% |
| May | -2.2% | +105.2% |
| June | -3.3% | +89.3% |
| July | +15.6% | +174.3% |
| August | +6.4% | +170.5% |
| September | +27.3% | +8.2% |
| October (prelim.) | -29.4% | -9.1% |
Value dropped from the +170% range in July–August to +8.2% in September. Units, though, also fell year on year in April through June and recovered in July. One month at -29.4% does not establish a new trend. Nor do these statistics say why units fell. I will check which products declined in October's final data (nine-digit codes by country), and whether the move is unique to Japan in Korean and Taiwanese published data.
Chipmaking tools grew in both machines and value
Chipmaking tools (HS 8486.10/20/40) rose 14.5% in machines (55,063) and 18.4% in value (¥2.9374 trillion) in January–September, both the highest since HS 8486 was created in 2007. September alone accelerated to +45.2% in machines and +45.5% in value. Average unit value rose only 3.3% over the nine months, so unlike ICs, value grew because more machines shipped.
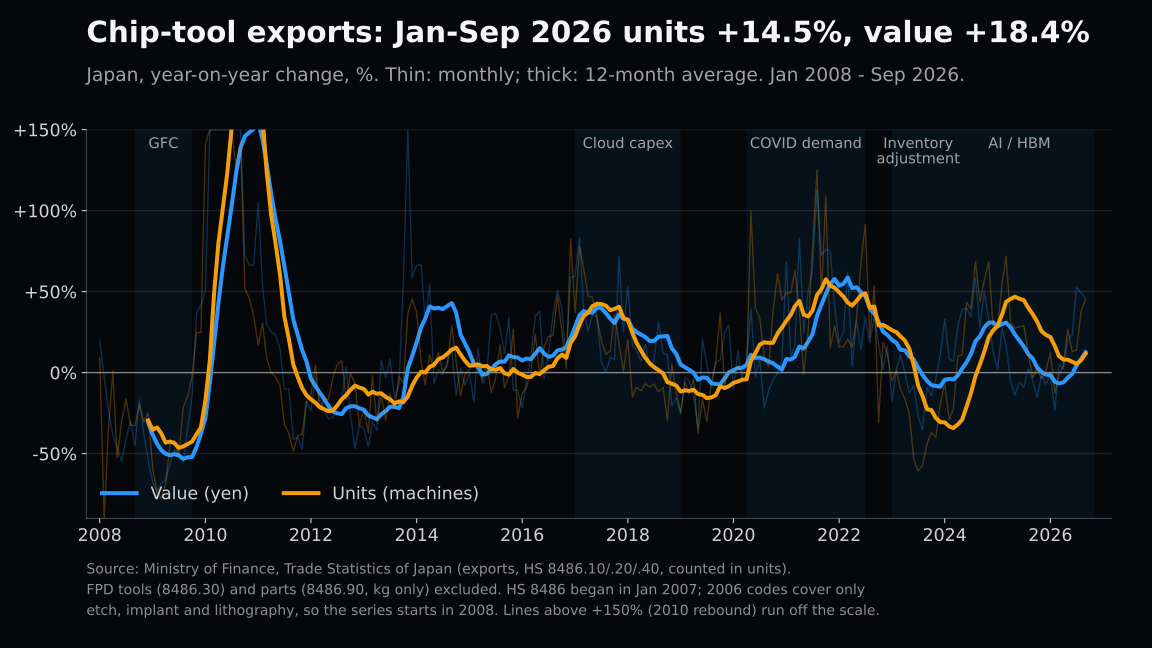
Does the machine count move ahead of IC units? Comparing 12-month averages of year-on-year growth from December 2008 to September 2026, the correlation is 0.83 with no lag and peaks at 0.86 when equipment trails ICs by three months. Shifting equipment three months ahead drops it to 0.60, and six months ahead to 0.26, so there is no sign of equipment leading. Turning points agree: ICs changed sign first in most cases, and in 2022 IC units turned negative in August while machine counts followed eleven months later, in July 2023. Machine counts are not a leading indicator of a turn in ICs, and today's equipment growth does not offset the decline in IC units.
The October preliminary release covers the ministry's summary category for chipmaking equipment, which is broader than the HS 8486.10/20/40 definition used here (for September, ¥553.3 billion versus ¥421.5 billion on the HS basis), and it reports quantities only by weight, so its October growth rates are indicative. World shipments were ¥544.2 billion (+49.7%) and 18,374 tonnes (+51.9%). By destination value: China ¥212.8 billion (+42.6%), the United States ¥63.4 billion (+118.5%), Korea ¥69.6 billion (+25.5%), the EU ¥23.3 billion (+144.8%) and ASEAN ¥43.0 billion (+26.2%).
The destination mix has shifted too.
| Share of chipmaking-tool export value | Jan–Sep | Jul–Sep |
|---|---|---|
| China | 36.7% | 42.8% |
| Taiwan | 27.1% | 22.6% |
| South Korea | 19.3% | 17.1% |
| United States | 8.3% | 8.6% |
For January–September as a whole, China rose 14.9% in machines but fell 2.1% in value, so average unit value dropped about 14.8% (my calculation). The growth there is mainly in machine count, and the reason is unknown.
Testers and inspection tools sit outside HS 8486
Not every chipmaking tool is in HS 8486. In Japan's export statistical schedule, 8486.20 covers machines for making semiconductor devices or integrated circuits; testers fall under 9030.82, which covers instruments for measuring or checking semiconductor wafers or devices, including ICs; and optical inspection tools fall under 9031.41, which also covers photomask and reticle inspection. Counting only 8486 machines leaves out the test and inspection steps.
Here is how process steps line up with product families listed on each company's public product pages. Companies do not publish which code each product is declared under, so this mapping follows the HS descriptions.
| Process step | Main HS code | Product families on public product pages (examples) |
|---|---|---|
| Deposition, lithography (coat/develop), etch, cleaning | 8486.20 | Tokyo Electron (deposition, lithography, etch, cleaning), SCREEN (wafer cleaning, coater/developers), KOKUSAI ELECTRIC (deposition systems) |
| Electrical testing of ICs | 9030.82 | Advantest (SoC, memory and power-device test systems) |
| Optical inspection of wafers and photomasks | 9031.41 | Lasertec (EUV and DUV mask products, wafer products) |
Test and inspection tools (9030.82 plus 9031.41) rose 4.8% in units, 41.4% in value (¥537.8 billion) and 34.8% in unit value in January–September. Split across the three nine-digit codes, the unit-value gain is +40.5% from like-for-like price and -4.0% from mix, so it is almost entirely price. In January–September 2026, front-end tools grew by machine count and test and inspection by price. In September the gap widened, with units -20.6% and value +32.6%. I have not checked this group's timing against IC units, so I do not use it for the turning-point call.
The numbers to watch before calling a turning point
Set against 20 years of data, October is unusual. In the 237 months from January 2007 to September 2026, IC units fell year on year while value rose more than 40% only once, in June 2022 (units -3.1%, value +41.2%). October exceeds that.
The 12-month average of unit growth has turned negative nine times since 2009. Among the cases with a result, value growth was still positive at the crossing six times, and in five of those the 12-month average of value growth also turned negative within 18 months (four of them overlap in a single 2014–15 episode, and two only just). Value growth was above +10% at the crossing only twice, in July 2015 and August 2022, and the outcomes split: a later low of -12.8% versus +0.7%. The unit average dipped below zero in December 2025 and turned straight back up, and value then accelerated (from +5.8% to +41.4% in September). With only two cases where value was growing fast, a drop in units cannot tell us where value goes next.
The 12-month average of unit growth stood at +7.3% in September. Adding October's preliminary figure brings it to about +6.3% (my calculation), so it has not turned negative again. November and December last year were weak months for units, at -5.0% and -5.3%, so the comparison base is low. These are world totals, for reference. If units excluding China, the measure I actually use, also fall year on year against that base, October will be harder to dismiss as a one-month swing.
The numbers below are ordered by how soon after the end of the month they come out. In recent practice, Korea's ministry publishes on the 1st of the following month, Japan's preliminary release comes around the 18th, and Japan's final data around the end of the following month (October 29 for September). Early numbers give the direction; later ones confirm it.
| Number to watch | Release (after month end, recent practice) | What it tells apart | Entry / pullback sign |
|---|---|---|---|
| Fixed prices for the representative DRAM and NAND products listed by Korea's ministry | 1st of the following month | Whether market-wide memory prices that support value keep rising | Guide for entry: prices stop rising. Guide for pullback: prices fall from the prior month |
| IC units (excluding China, and China) | Around the 18th (preliminary) | Whether the decline is China-only or spreading beyond it | Units excluding China fall year on year two months running |
| Memory (8542.32) unit value | Japan's final data (Oct 29 for September) | Whether the prices behind value hold in Japan's exports | Entry: in both of the same two months as units, y/y rate below the prior month's (easy to meet as last year's level rises). Pullback: y/y negative |
| Chipmaking-tool (8486) machine count | Japan's final data (same) | Whether cuts have reached shipments | Confirmation only (it lags ICs, so it does not trigger a move) |
NAND fixed prices have been flat since September ($30.6), so NAND reached the entry sign in October. The price side is judged on Japan's memory unit value; fixed prices are only a guide.
Scenarios and my call
| Scenario | What happens | Read-through for semiconductors | What I do |
|---|---|---|---|
| Base case | October was a one-month swing in China. Units excluding China keep growing and memory unit value keeps growing year on year | Value growth continues | Keep semiconductor exposure |
| China only | Units to China keep falling, but units excluding China stay above last year | Outside the definition; value growth narrows but stays positive | Keep exposure and check products in the final data |
| Entry to a turning point | Units excluding China fall year on year two months running, and in both of the same two months memory unit value's year-on-year rate is below the prior month's (slowing is enough; it need not turn negative) | Value growth narrows on both volume and price | Start reviewing exposure with a view to cutting it |
| Demand pullback | The entry conditions plus memory unit value falling year on year | Value falls on both volume and price | Cut exposure |
If only one of the units and unit-value conditions is met, I do not count it as entry; instead, I check the products in the final data.
My call is not to change semiconductor exposure on one month of data. In the short term, meaning until the November and December preliminary releases are out, I am neutral, and in the meantime I will check October's final data by product. Equipment, which lags, and value, which is propped up by price, are slow to show cuts. The time frames also differ: the market is pricing expected cuts within six months (52%), while export statistics record shipments already made, so they can neither confirm nor rule out future cuts. That is why I put the weight on units excluding China. Shipments to China fell in both units and value, but I am not changing exposure: what matters is whether the decline spreads beyond China.
What would change my mind is the entry to a turning point as defined above. Memory unit value's year-on-year rate fell below the prior month's in September. But entry is judged over the same two months as units, so it does not count until the unit side (units excluding China, +9.7%) falls year on year. Rising unit value with falling units is consistent with weaker demand, but also with supply constraints or a shift toward pricier products, and these statistics alone cannot separate them. October's China figures fit that pattern: units -29.4%, value -9.1%, unit value up about 29% (my calculation). Only when unit value falls year on year will I read it as a demand pullback.
About the numbers in this post
- Sources are the Ministry of Finance commodity series (exports, nationwide, monthly; final data January 2006–September 2026) and the preliminary trade statistics for October 2026, released November 18, 2026. October is preliminary and may be revised in the final data.
- ICs are HS 8542.31/32/33/39 (8542.21/29/60/70 under the 2006 classification), excluding smart cards (8542.10) and parts (8542.90). Discrete semiconductors are HS 8541, excluding 8541.60 and 8541.90.
- Chipmaking tools are machine counts under HS 8486.10/20/40. Flat-panel tools (8486.30) and parts (8486.90, reported only in kilograms) are excluded from machine counts. HS 8486 was created in 2007; the 2006 codes that map cleanly cover only etch, ion implantation and lithography, about 42% of 2007 value, so the series is not linked to 2006 and year-on-year changes start in January 2008.
- October equipment figures come from the ministry's broader summary category and are reported in tonnes only, so they are indicative and not joined to the machine-count series.
- Average unit value is value divided by units (or machines). Codes reported in thousands were multiplied by 1,000. All values are nominal yen, with no adjustment for inflation or exchange rates.
- Figures marked "my calculation" are derived from published data. The phase labels in the figures are my own.
Related Posts
- US stocks at year-end across 50 seasons — separating a broad selloff from calendar effects.
- Big Tech's July–September 2026 earnings on one definition — cloud capex and cash flow, the demand behind these exports.
- How far rate risk reaches into tech capex — how expectations of capex cuts form.
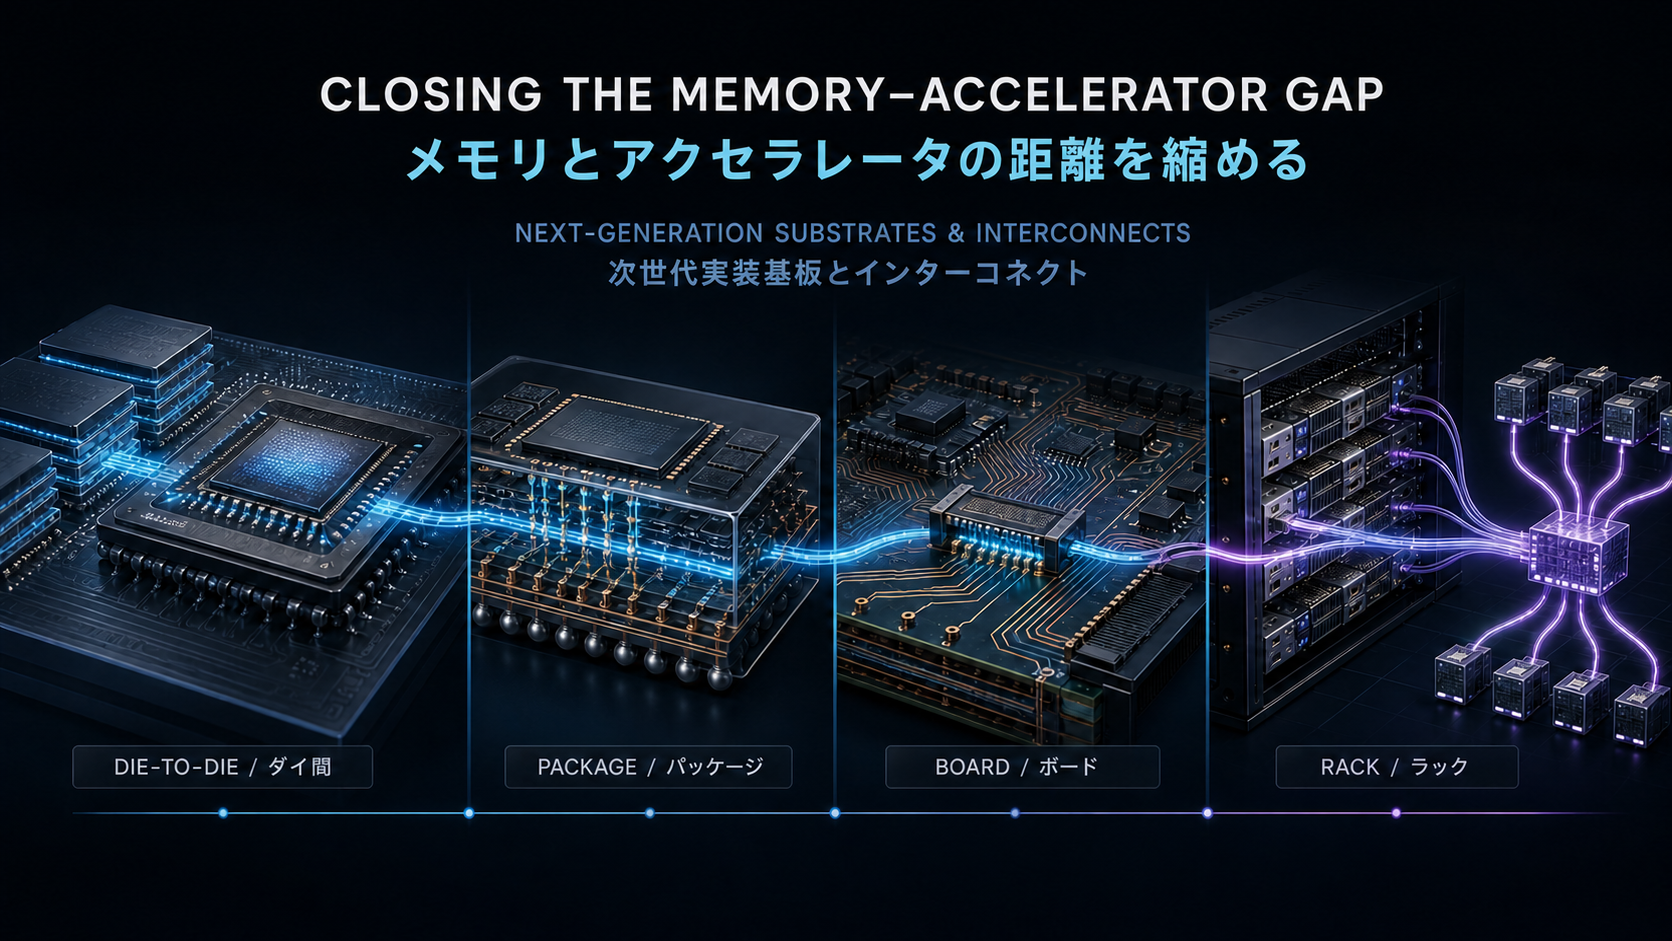
- Closing the distance between memory and accelerators — the packaging layer that links memory and compute chips.
References
- Ministry of Finance, Japan, Trade Statistics: commodity series (exports, monthly) and October 2026 preliminary release
- Japan Customs, Export Statistical Schedule (January 2026 edition, Japanese): Chapter 84 and Chapter 90
- Korea Ministry of Trade, Industry and Resources: October 2026 trade release and September 2026 trade release
- Reuters via Newsweek Japan, November 18, 2026, BofA survey on tech allocation; Paperjam, Investors cool on AI; Atrani Capital, November 2026 BofA Global Fund Manager Survey
- Yahoo Finance, November 20, 2026, Stock market today
- Company product pages: Tokyo Electron, SCREEN, KOKUSAI ELECTRIC, Advantest, Lasertec
Next Issue Ideas
- Idea 1: Splitting memory prices with October's final data — Once nine-digit detail is out, check whether memory unit values kept rising in October and which products carried the unit decline.
- Idea 2: Three groups of tools, front-end, test and inspection — Compare tools that grew by machine count in January–September 2026 with tools that grew by price, from the outside, using public materials from at least three companies such as Tokyo Electron, Advantest and Lasertec.
- Idea 3: Is the drop in IC exports to China unique to Japan? — Check Korean and Taiwanese published data for November–December. Korea's ministry release texts carry no semiconductor quantity figures, so Korea will be read through export value and fixed prices.
This post is not investment advice. The author may hold positions in the securities mentioned. Generative AI was used in preparing it. See the disclaimer for details.