Retrofitting AI Rack Cooling: Where 100 kW of Heat Goes
Use a hypothetical 100 kW AI rack to trace heat from cold plates through a CDU to the outdoor plant, and work out which parts of a live data center a liquid-cooling retrofit can reuse.
Use a hypothetical 100 kW AI rack to trace heat from cold plates through a CDU to the outdoor plant, and work out which parts of a live data center a liquid-cooling retrofit can reuse.
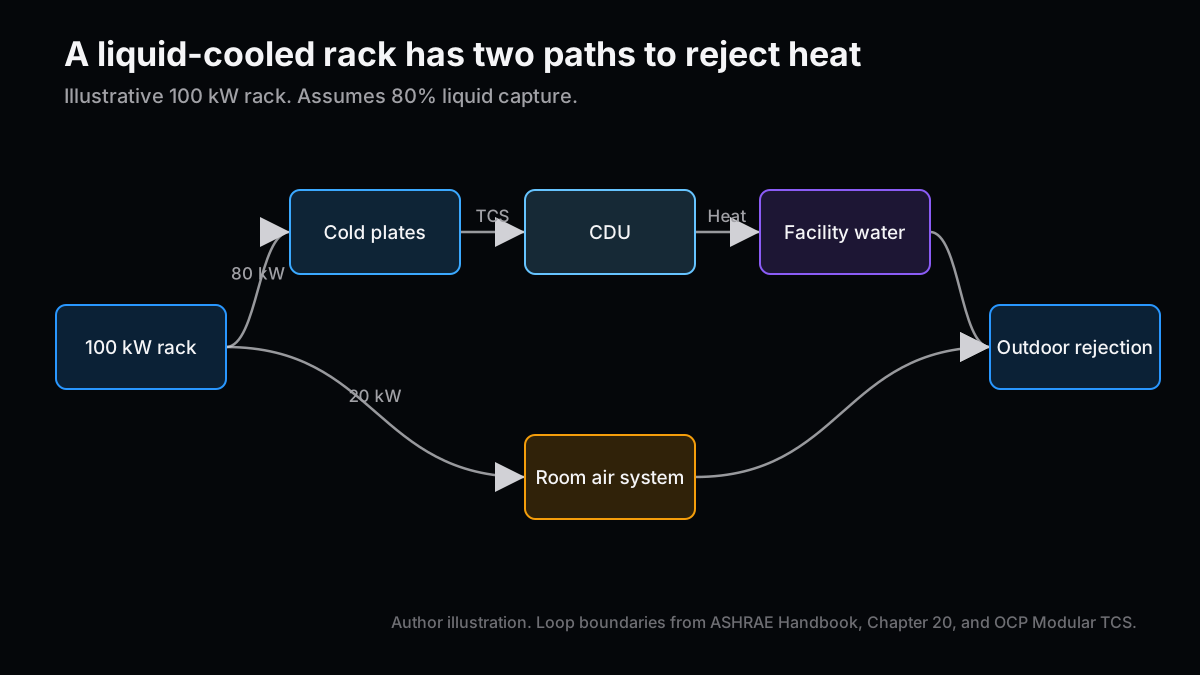
Take a rack drawing 100 kW and assume liquid captures 80% of its heat. The liquid loop carries 80 kW, and the room air carries the other 20 kW. Before pricing a retrofit, I would check whether both paths can reject that heat outdoors on the site's design summer day.
This article uses public information available as of November 18, 2026. The 100 kW rack and calculated flow rates are illustrative and are separate from figures announced by suppliers.
On November 17, Ecolab used SC26 to announce collaborations covering liquid cooling, power distribution, heat exchangers, and design simulation. In a piece on building quantum computers at scale, I looked for results from a device inside its cryostat. A result on a chip tells you less about a finished machine than a test across the interfaces that still have to be assembled. A cooling retrofit poses a similar question. A rack may pass acceptance on a test stand, while the building that will receive it needs new piping or a larger heat-rejection plant.
The air-cooling system still has a job
Consider a direct-to-chip setup with a liquid-to-liquid coolant distribution unit, or CDU. Cold plates move heat from selected components into coolant. The technology cooling system (TCS) connects the racks to the CDU. On the other side, the facility water system (FWS) carries heat onward. The heat exchanger transfers energy between the loops while keeping their liquids separate in normal operation. Heat from components outside the cold-plate circuit still reaches the room. Heat from upstream power equipment also needs attention and falls outside the 100 kW rack example. ASHRAE Handbook Chapter 20 and OCP Modular TCS §3.7
The room may have air-cooling capacity on paper and still lack the airflow needed at the end of a particular row. I would open the layout and ask where the air goes, how warm it is when it reaches the rack, and which racks share the same air handler. A building that is gaining a liquid-cooled row usually still has other equipment operating during construction. A retrofit budget can count only the air-side capacity that the operator can actually release.
When I worked on automotive EEPROM process development, I used TCAD to trace a yield problem that had been attributed to the equipment back to process conditions. That experience shaped how I read a cooling failure. If a rack runs warm, an inlet temperature and a flow reading can tell you where to look next. A fault assigned broadly to “the CDU” may send the maintenance team toward the wrong side of the heat exchanger.
Rack piping has to deliver both flow and pressure
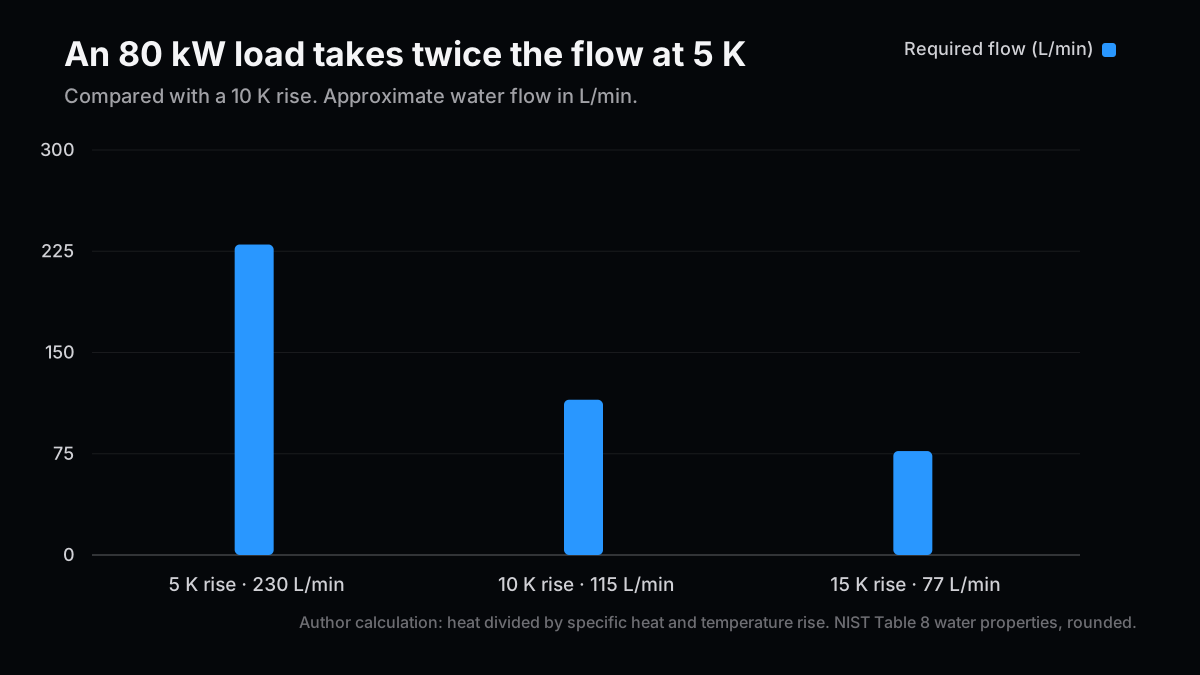
Keep the assumed 80 kW of heat captured by the liquid. With a fixed fluid, halving the temperature rise from supply to return doubles the flow needed to carry that heat. I approximate the liquid as water with a specific heat of 4.18 kJ/(kg·K) and a density of 1 kg/L. Actual commissioning calculations need the properties of the coolant specified for the rack. NIST water properties, Table 8
| Rack loop temperature rise | Heat carried by liquid | Approximate flow |
|---|---|---|
| 5 K | 80 kW | 230 L/min |
| 10 K | 80 kW | 115 L/min |
| 15 K | 80 kW | 77 L/min |
I divide the 80 kJ transferred per second by the specific heat and temperature rise to get mass flow, then use the assumed density to convert to liters per minute. For the middle row, 80 ÷ (4.18 × 10) × 60 comes to about 115 L/min. The third row illustrates the arithmetic. Equipment limits determine whether 15 K is a feasible operating point.
Fitting a CDU in the row gets the pipe run started. It still takes adequate differential pressure to deliver the required flow through the most restrictive branch. Pipe lengths, connectors, valves, and filters all contribute to the pressure drop. At turnover I would ask for readings with all branches in service and again with some branches isolated. A good reading at the CDU can conceal poor distribution elsewhere in the loop.
The OCP design paper treats fluid compatibility, flow design, and cleaning of the headers and branches as separate jobs. Before reusing a pipe, the installer has to identify its materials, verify where it goes, and confirm that it can be flushed and tested without sending debris through the cold plates or interrupting neighboring equipment. OCP Modular TCS §§3.4–3.6 and Appendix G
Summer conditions determine what stays at the plant
In this setup, the CDU's technology-side supply temperature depends on the incoming facility water and the performance of the heat exchanger. An OCP study modeled a 6 K cold-side approach across the CDU. At 30°C TCS supply, that assumption gives 24°C FWS supply to the unit. Check the proposed CDU performance at the intended load, flow, and fluid before applying the modeled difference to a project. OCP 30°C Coolant, pp. 21–22
| OCP model case | TCS supply | Assumed CDU approach | FWS supply |
|---|---|---|---|
| S20 | 20°C | 6 K | 14°C |
| S30 | 30°C | 6 K | 24°C |
| S40 | 40°C | 6 K | 34°C |
There are two temperature differences on the drawings. The flow calculation uses the temperature rise between the rack supply and return. The CDU approach uses the cold temperatures on opposite sides of the heat exchanger: the TCS supply leaving for the racks and the FWS supply arriving from the plant. Write down both measuring points before carrying a temperature difference into a capacity estimate.
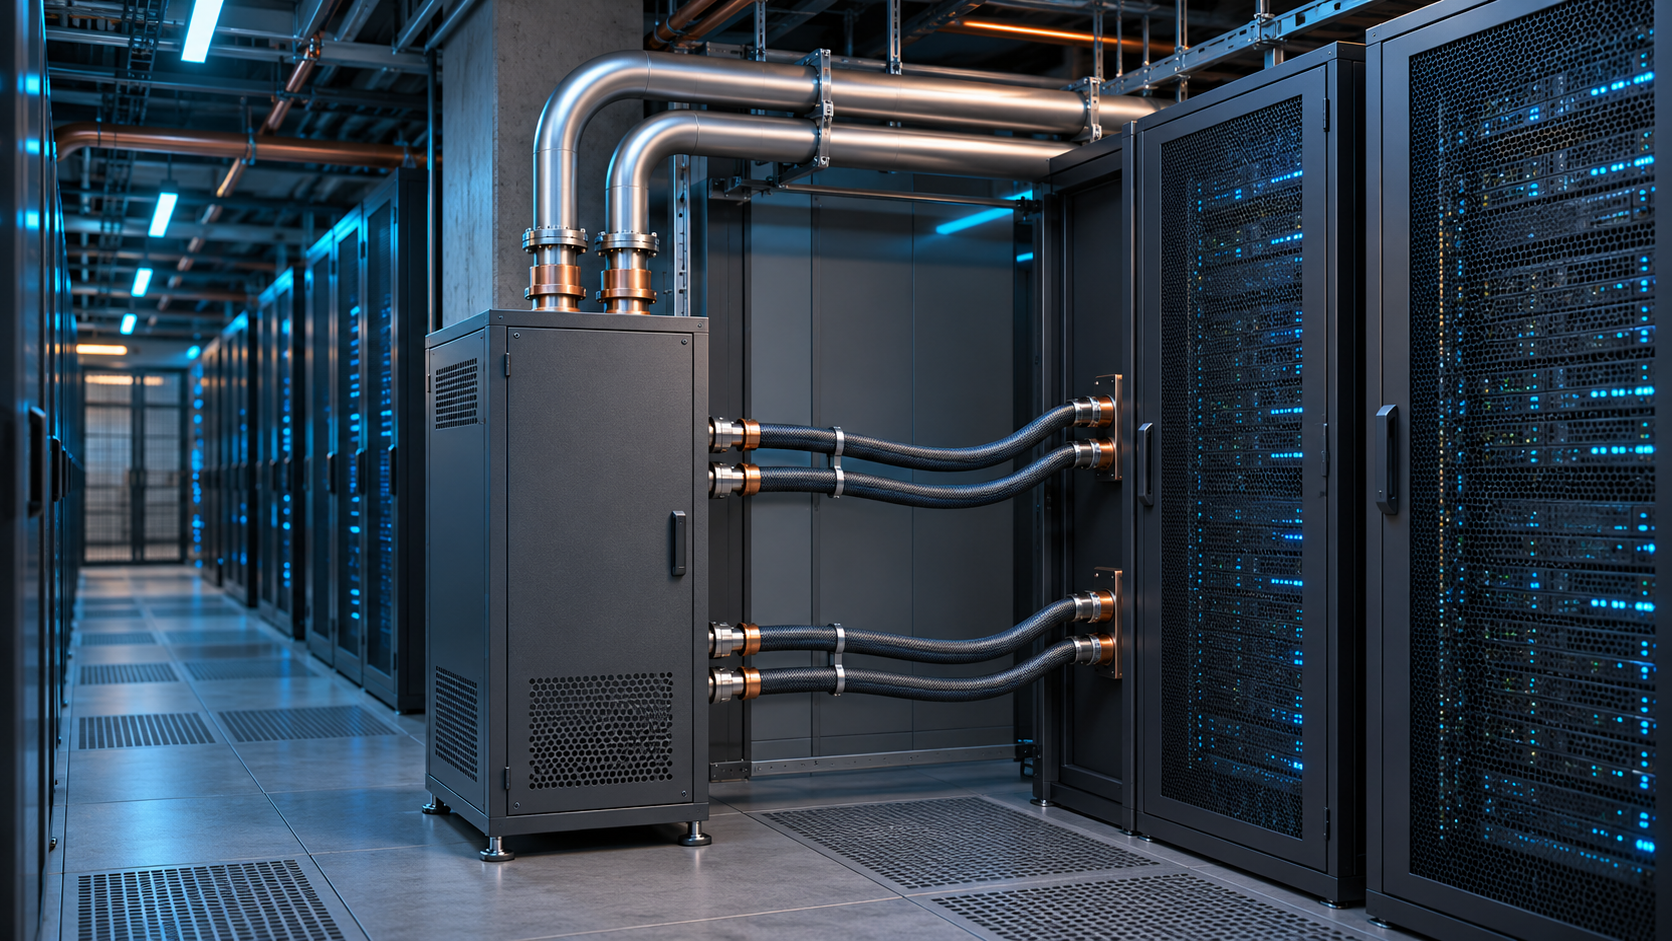
To see whether an existing dry cooler can stay, pull the site's summer outdoor design conditions and the cooler's leaving-water temperature at the intended load. If the facility falls short in hot hours, the design may need supplemental chiller operation, more heat-rejection capacity, or racks that accept warmer coolant. An evaporative design also brings on-site water availability into the decision. Annual averages can make a plant look efficient while leaving little headroom on the hottest afternoons. Those afternoons can cap the number of racks the operator can bring online. ASHRAE Handbook Chapter 20, Table 2 and liquid-cooling guidance
On the construction side, I would inspect the overhead routes and ask where the new branches can be connected, flushed, and isolated while the neighboring rows keep operating. Even a reusable pipe can turn into an expensive job if it serves a large area behind a single valve. The installation schedule depends partly on the number of cutovers and how much equipment loses cooling during each one.
What the announcements establish
Ecolab's November 17 release spells out roles across design, hardware, and controls. On October 16, Vertiv announced delivery of a direct-to-chip installation with CapitaLand India Trust in Navi Mumbai. Vertiv said the secondary fluid network can support 30 MW of AI workloads. The release leaves the site's actual peak load, cooling power draw, and share of existing piping reused undetermined. Ecolab, November 17 and Vertiv, October 16
| Disclosure | Published scope | What a retrofit buyer still needs |
|---|---|---|
| Ecolab and Siemens, Nov. 17 | Ecolab liquid cooling and CDU technology combined with Siemens power distribution and automation | Acceptance tests for power and cooling controls, plus the operator's escalation path |
| Ecolab and Alfa Laval, Nov. 17 | Heat-exchanger and flow components for a next-generation CDU initiative | Temperature, flow, and differential pressure at the design point, plus service isolation |
| Ecolab and Dassault Systèmes, Nov. 17 | A demonstration linking models of the rack, CDU, and facility water system | Deviations between the model and readings from an installed system under variable load |
| Vertiv and CapitaLand India Trust, Oct. 16 | A delivered secondary fluid network described as supporting 30 MW | Scope of any reuse or cutover and operating readings after installation |
A design model can tell an operator which configuration to test. The evidence of lower electricity or water use comes from operating records. Comparing power usage effectiveness (PUE), calculated as facility energy divided by IT energy, requires a common reporting period and consistent metering. For on-site water, define whether the figure counts withdrawals or consumption, and include IT energy for the same period. A reported pump draw at the rack says little about the rest of the plant. Weather and workload matter too. Any reported improvement has to survive a comparison with the loads the site previously handled. ASHRAE Handbook Chapter 20 §3.4
The investment judgment turns on a test with backup equipment
Before translating announced capacity into addressable deployments or revenue, I would ask what the operator can keep running during a changeover. The cases below are design questions, using the same hypothetical rack to put numbers next to the acceptance tests.
| Scenario | Boundary in the 100 kW example | Planning consequence |
|---|---|---|
| Reuse most of the plant | Under summer design conditions, the plant maintains the required facility supply-water temperature. The liquid loop carries 80 kW at about 115 L/min and a 10 K rise, and air cooling handles the remaining 20 kW. | Start with the CDU and distribution, then verify capacity before rolling out to another row. |
| Replace part of the plant | The row can get 115 L/min, but the facility water temperature rises above its requirement in summer. | Price additional outdoor heat rejection and retain the existing air system through the cutover. |
| Delay or relocate racks | A changeover to backup equipment leaves inadequate rack flow or air capacity for the residual 20 kW. | Reduce the proposed count or move racks, then repeat the changeover test. |
A useful field report would show rack inlet temperature, coolant flow, and IT load while the operator switches pumps or isolates a branch. It would also identify who takes the alarm, which equipment can be isolated, and what the crew needs to return it to service. Those details let an investor weigh the value of purchasing installation and service through one supplier. I would change that assessment if equipment from separate suppliers passed the same test at different existing facilities using a repeatable commissioning procedure. The next disclosure I would look for is the load that stayed online during the changeover and the area of the building that had to be taken out of service to complete the installation.
Related Posts
- 800V DC certification and facility acceptance — Where component compliance meets the operating requirements of a full site.
- Three quantum manufacturing challenges — What an assembled device can tell us about manufacturing at scale.
References
- Ecolab, SC26 liquid-cooling collaborations, November 17, 2026
- Vertiv, Navi Mumbai direct-to-chip installation, October 16, 2026
- Open Compute Project, Modular Technology Cooling System, August 25, 2025
- Open Compute Project, 30°C Coolant, October 1, 2024
- ASHRAE Handbook, Chapter 20, 2023 edition
- NIST, Reference Correlations for Thermophysical Properties of Liquid Water, 2009, Table 8
Next Issue Ideas
- Where cooling retrofit costs land — Compare equipment, installed piping, commissioning, and service using supplier disclosures.
- How many more racks fit on the same utility feed? — Examine where spare power and spare cooling disagree and how operators decide which to expand first.
- Compare wet and dry heat rejection through the same summer — Hold workload and weather constant to compare chiller runtime and on-site water use.
This article is for information and does not constitute investment advice. The author may hold positions in securities mentioned. Generative AI assisted in preparation. See the disclaimer for details.