Who Decides a Startup Is Worth a Trillion Yen? A Ramen Shop Shows the Same Business Can Be ¥44M or ¥170M
Who sets the trillion-yen valuations in the news? Run the math on a ramen chain and one change in the growth forecast moves the price almost fourfold. All you need is multiplication and division.

Who sets the trillion-yen valuations in the news? Run the math on a ramen chain and one change in the growth forecast moves the price almost fourfold. All you need is multiplication and division.

The ramen shop is made up for the sake of the math. The companies mentioned later are an outside read from public information only, with no interviews or non-public material. Checked as of October 31, 2026 (Asia time).
What is a ramen chain with ¥100M in sales worth?
Assume sales grow 1.3 times a year, and the answer is ¥44M. Assume 1.7 times, and it is ¥170M.
The trillion-yen valuations in the news work the same way. They are not figures from a set of accounts. They are prices put on a forecast.
I have been involved in more than 20 startup investments at a venture capital firm. This is a calculation I use at work, and there is nothing in it beyond multiplication and division. Numbers that large are hard to feel, so today let's run it on a ramen shop.
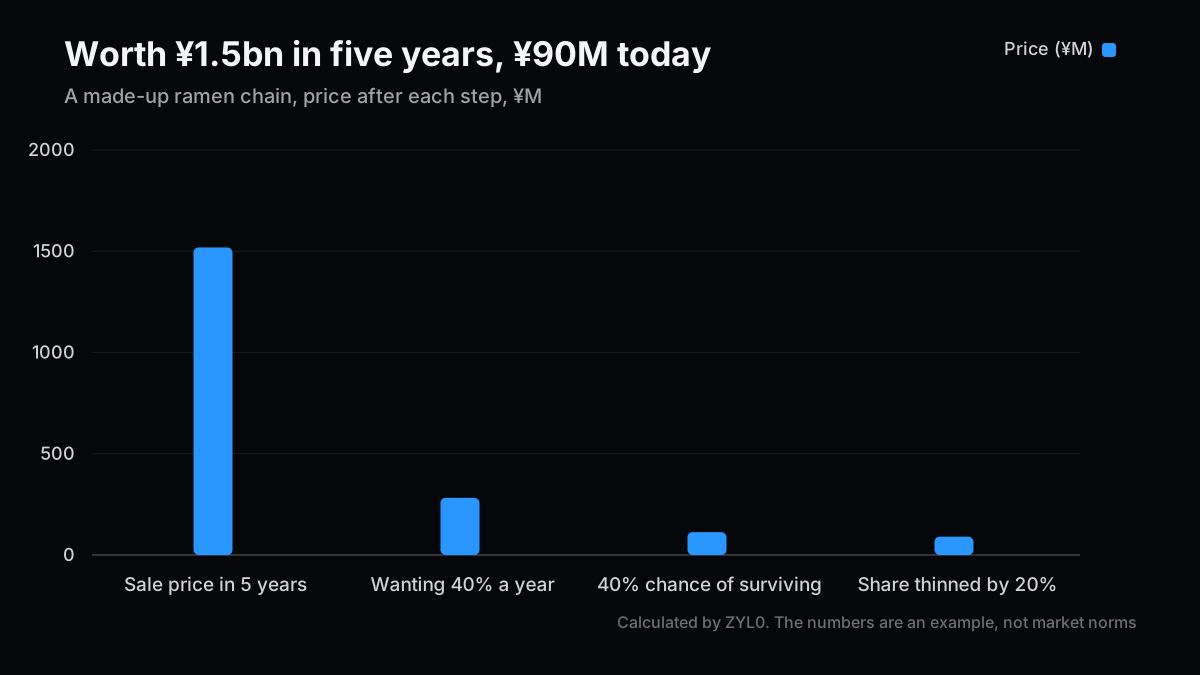
A Shop Worth ¥1.5 Billion in Five Years Is Worth ¥90 Million Today
That may look far too cheap. Let's work through it.
Picture a made-up chain.
- Sales today are ¥100M
- Sales grow 1.5 times every year, reaching ¥760M in five years
- 20% of sales is left as profit, so ¥150M in five years
- The shop sells for 10 times its profit, so ¥1.5bn in five years
On that alone it is a ¥1.5bn business. But nobody investing today pays ¥1.5bn. There are three reasons.
| Why the price comes down | Math | What is left |
|---|---|---|
| The sale price in five years | — | ¥1,520M |
| Wanting 40% a year (5.4 times in five years) | ¥1,520M ÷ 5.4 | ¥280M |
| It might fail (a 40% chance of surviving) | ¥280M × 0.4 | ¥110M |
| New shareholders thin your share by 20% | ¥110M × 0.8 | ¥90M |
That is all of it. What professionals call the "VC method" is barely more than this.
40% a year may sound absurd. An investment growing 7% a year only reaches 1.4 times in five years. But plenty of startups go to zero, and the winners have to pay for the losers, so the number has to be big.
To be honest, this example is on the harsh side. You could argue the 40% already includes the chance of failure, and the survival step counts it again. Professionals disagree about this.


The Growth Forecast Moves the Price Most
So which number moves the price the most? This is where the exercise surprised me.
Change one number and leave the rest alone.
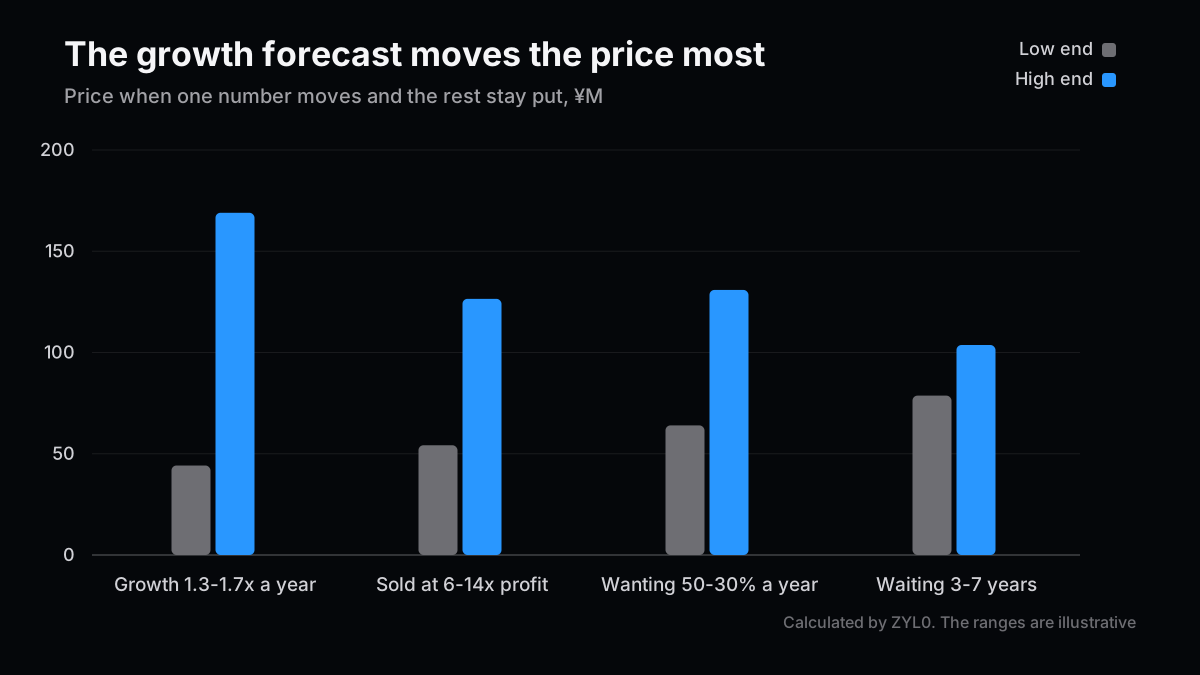
Move sales growth from 1.3 to 1.7 times a year, and the price runs from ¥44M to ¥169M, a 3.8-fold gap. Move the sale multiple from 6 to 14 times profit and it is only 2.3-fold. Move the wait from three years to seven and it is just 1.3-fold.
Why does the growth forecast matter so much? Because it gets multiplied five times. 1.5 times, five times over, is 7.6. 1.7 times, five times over, is 14.2. A small-looking difference nearly doubles the result in five years.
It gets clearer when you ask how much of the shop a ¥30M investment buys.
| Sales growth each year | Price of the shop today | Share ¥30M buys |
|---|---|---|
| 1.3 times | ¥44.2M | 67.9% |
| 1.5 times | ¥90.4M | 33.2% |
| 1.7 times | ¥169.0M | 17.8% |
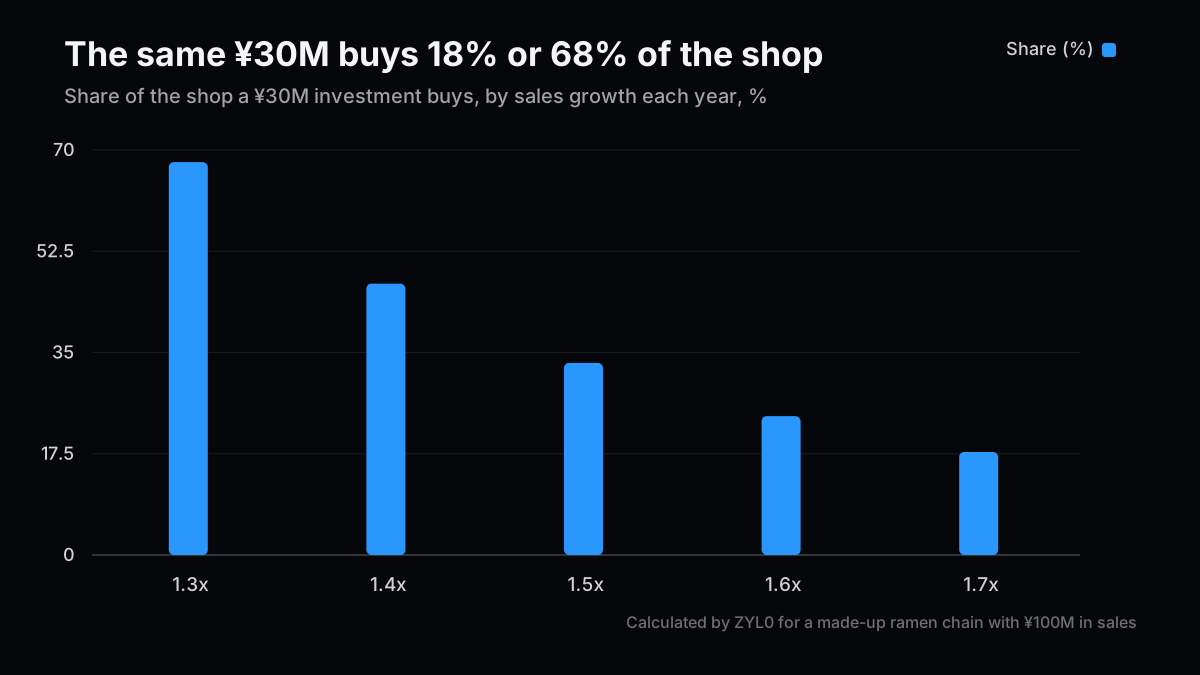
Same shop, same ¥30M. Does it buy two-thirds of the business, or less than a fifth? That is what the negotiation is really about.
Interest rates play a part too. As I wrote in No. 71, the US 10-year yield touched 5.36% in October. When safe returns go up, investors tend to ask for more. Raise the 40% to 50%, and this shop falls to ¥64M.
So a valuation is less the price of what a company is today than the price of a forecast. Change the forecast, and the price changes even though nothing about the shop has changed.

Working Back From an $11 Billion Headline
Run the same math in reverse and funding news reads differently.
I picked three large funding rounds from this year and asked what would have to be true in five years for each price to hold. This says nothing about whether these companies are good. It is practice.
My placeholders: investors want 25% a year for five years, later shareholders thin the stake by 15%, the eventual sale is at 24.48 times profit (roughly where US software companies trade), and profit is 20% of sales.
| Funding round | Valuation | Price needed in 5 years | Sales needed in 5 years |
|---|---|---|---|
| ElevenLabs (voice AI, Feb 2026) | $11bn | $39.5bn | $8.1bn |
| Harvey (legal AI, Mar 2026) | $11bn | $39.5bn | $8.1bn |
| Valar Atomics (nuclear reactors, Aug 2026) | $6bn | $21.5bn | $4.4bn |
At ¥150 to the dollar, $11bn is ¥1.65 trillion. ElevenLabs reported more than $330M in annual recurring revenue at the end of 2025. Getting from there to $8.1bn means about 24 times in five years, or 1.9 times every year.
I am not saying it cannot happen. But once you know the headline "$11 billion" carries a forecast of 1.9 times a year for five years, the news reads differently.
Where I paused was dropping the profit multiple from 24 to 15. The required growth rises to 2.1 times a year. One changed assumption, and the story changes that much.

What to Check When You See a Valuation
First, the question in the title. A valuation is not set by a regulator or an exchange. It comes out of a negotiation between a company and whoever put in money last. The investor runs something like this math to decide how far they will go, and the company wants the highest price it can get. When several investors want in, the price climbs. That is why one company's valuation can jump within months: Valar Atomics was reported at $2bn in April this year and $6bn in August.
With that in mind, here is what to use when reading the news. I counted, and there are four.
- That money does not exist anywhere. ElevenLabs raised $500M, which is 4.5% of its $11bn valuation. A valuation is the price paid for some shares, multiplied across all of them
- Look at the multiple of sales. $11bn ÷ $330M is 33 times sales. The ramen shop was 0.9 times today's sales
- Ask how many years at how much growth it assumes. Doubling every year adds up fast
- It does not work without visible sales. A nuclear reactor company with no visible sales gives this math nowhere to start. Odds on technical milestones get you further
And a word on what this is not for. It will not guess the right price, and it is no tool for picking stocks. It is for asking what you have to believe for a price to hold.
If you want to move the numbers yourself, I built a free calculator. There is no sign-up, and its starting values are this ramen shop, so try changing just the growth. It uses industry terms, but read "EV/EBITDA multiple" as how many times profit it sells for, and "target IRR" as how much a year you want to grow your money.
I still have one doubt as I finish. Using a homely example may make a reactor company look like the same story as a noodle shop. As a way in, though, I think it beats being so overwhelmed by the zeros that you stop thinking about it.
Related Posts
- Did the AI Bond Rush Push Up US Long-Term Yields? — The rates underneath what investors ask for
- Cloud Revenue Doubled at the Top, Yet Three of Four Can't Fund Their Capex — What listed companies' share prices actually reacted to
References
- Valuation of Pre-revenue Companies: The Venture Capital Method (Bill Payne)
- Enterprise Value Multiples by Sector, January 2026 (Aswath Damodaran, NYU Stern)
- ElevenLabs Series D (ElevenLabs, February 4, 2026)
- Harvey confirms $11B valuation (TechCrunch, March 25, 2026)
- Sequoia leads $1B round for Valar Atomics (Axios, August 3, 2026)
Next Issue Ideas
- Idea 1: What Is a 1% Stock Option Worth by IPO? — The thinning of ownership, worked through from the point of view of someone working at a startup, with questions to ask before joining.
- Idea 2: Did You Grow, or Did the Yen Just Fall? — Where a home-made investment spreadsheet quietly goes wrong.
- Idea 3: Why Do Prices Fall Right After Listing? — Reading the gap between private valuations and post-IPO share prices from public information.
This post is not investment advice. The author may hold securities of the companies mentioned. Generative AI was used in preparing it. Please read the disclaimer before making any investment decision.