Oil's New Map, Six Months Into the Iran War — Part 1: How Routes and Stockpiles Actually Shifted
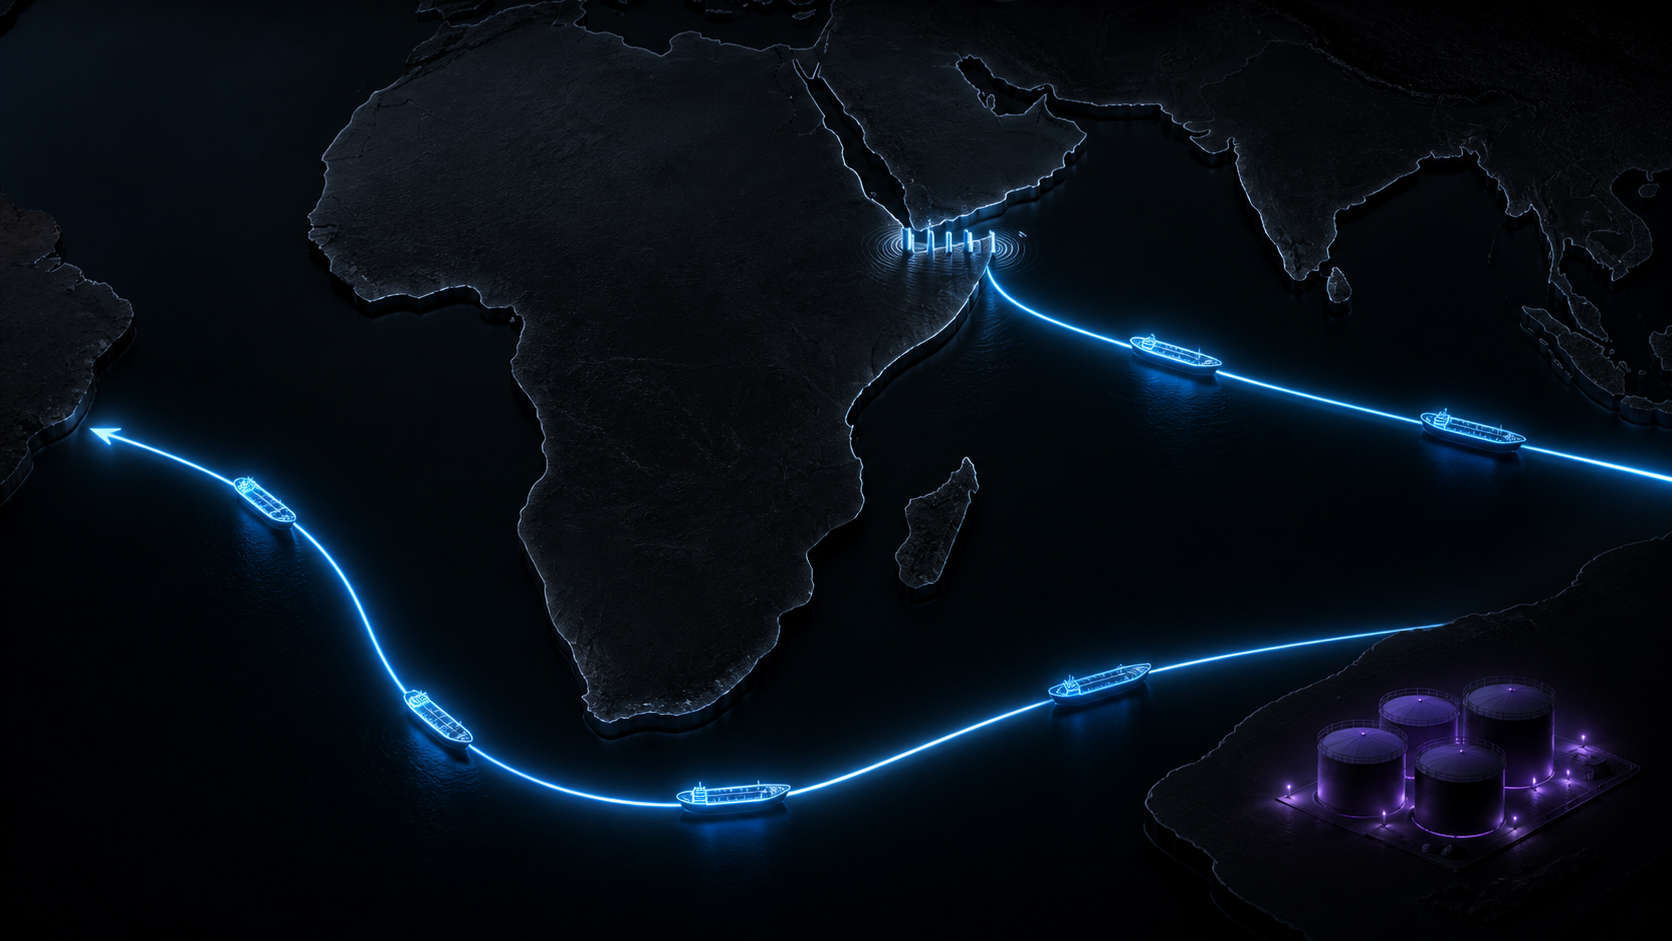
Six months after the Hormuz blockade began: the Cape of Good Hope reroute, the IEA's record 400-million-barrel release, and the completed 172-million-barrel US SPR refill, verified against primary data.
Six months after the Hormuz blockade began: the Cape of Good Hope reroute, the IEA's record 400-million-barrel release, and the completed 172-million-barrel US SPR refill, verified against primary data.


Oil's New Map, Six Months Into the Iran War — Part 1: How Routes and Stockpiles Actually Shifted
When I wrote about coal stocks at the end of March, I promised myself a follow-up: revisit the thesis with fresh numbers and separate what strengthened from what broke. Five months later, my honest first reaction while drafting this is that I didn't expect the situation to drag on this long. This time I'm setting coal aside and focusing on the two datasets that sit upstream of every other story here — transport routes and stockpiles — and taking inventory of what actually happened.
Six Months at a 90% Traffic Collapse
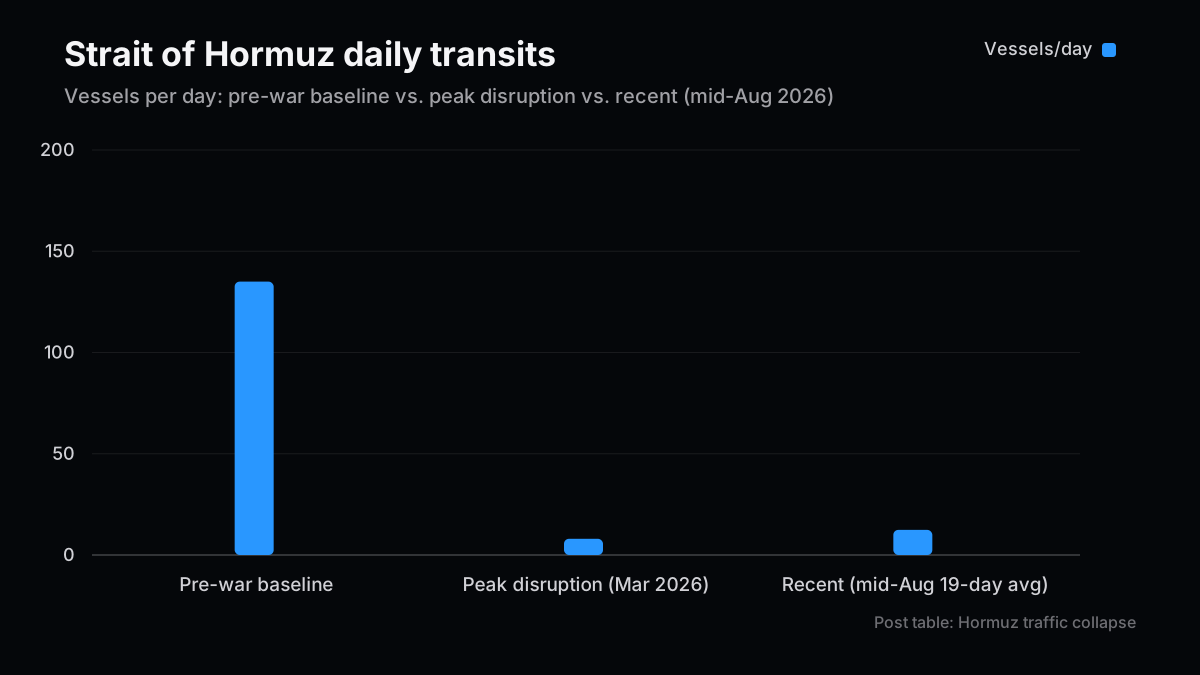
Let me start with the number that surprised me most. Before the war, the Strait of Hormuz carried roughly 130-140 vessels a day, one of the busiest maritime chokepoints on earth. Within days of the March 2 blockade, transits fell to as few as 16 vessels over a two-day span at the worst point.
Six months on, where do things stand? The most recent observation window (19 days in mid-August) recorded 236 transits — an average of roughly 12 ships per day. A roughly 90% shortfall from baseline has, remarkably, held steady for most of the past six months. And more than 80% of the liquids still transiting recently move through an Oman-led, UN-authorized corridor that Iran openly objects to — so "the strait is open" overstates it. A more accurate read is "one narrow, internationally brokered lane functions, bypassing the jurisdiction Iran claims."
The biggest unresolved item from my March 28 piece was the "April 6 deadline." The sequence that followed is tangled enough to warrant a timeline.
| Date | Event |
|---|---|
| Apr 5-6 | Trump issues a 48-hour final ultimatum to Iran, threatens to "decimate Iran in one night," hints at strikes on power plants and bridges |
| Apr 6-7 | Iran refuses to negotiate under pressure but offers a 10-clause counterproposal covering a ceasefire, safe-passage protocol, sanctions relief, and reconstruction |
| ~Apr 8 | Iran agrees to reopen Hormuz; Trump announces a two-week ceasefire |
| Mid-April | The ceasefire proves short-lived; the US reimposes a naval blockade after the "Islamabad Talks" collapse |
| June | The US and Iran sign an MOU |
| July | Conflict resumes as Iran strikes shipping it deems "noncompliant" |
| Early August | The US reimposes the naval blockade again |
| Aug 25 | The US imposes new sanctions on Iran targeting aviation, shipping, technology, gold, and digital assets |
| Aug 26 | Iran and Oman advance talks on a phased "temporary shipping corridor" framework, including mine clearance |
Net-net, this half-year has cycled through "ceasefire → breakdown → blockade" almost four times. April 6 wasn't the resolution — it was lap one. Markets are reading the August 25 sanctions shift toward economic rather than military tools as a de-escalation signal, and honestly, I'm still on the fence about that. The fact that the Iran-Oman corridor framework explicitly includes "mine clearance" is itself an admission that mines are still there.
The Cost of the Detour: Cape of Good Hope and Pipeline Alternatives
The 90% of vessels that stopped transiting Hormuz didn't vanish. They just changed course.
Maersk, CMA CGM, and Hapag-Lloyd all redirected their Middle East-Europe and Middle East-US East Coast services around the Cape of Good Hope. That adds roughly 3,800 nautical miles and 10-14 days per voyage. Industry estimates put the fleet-wide added cost — fuel, insurance, higher charter rates — at $40-50 million per week.
Pipeline alternatives exist, but the capacity gap is an order of magnitude. The UAE's ADCOP pipeline and Saudi Arabia's Petroline (the East-West pipeline to the Red Sea port of Yanbu) are real bypass routes, but between them they absorb only a fraction of the 17.8 million barrels a day that used to move through Hormuz. Worse, the Red Sea leg itself depends on the Bab el-Mandeb strait staying stable — a second chokepoint sitting behind the first one. The honest summary is: detours exist, but they're narrow, slow, and dependent on a different pinch point holding.
| Route/Mode | Added cost / time | Actual absorption capacity |
|---|---|---|
| Cape of Good Hope reroute (sea) | +~3,800nm, +10-14 days, ~$40-50M/week fleet-wide | Effectively unlimited, at a cost |
| UAE: ADCOP pipeline | Pipeline tariff only | A small fraction of Hormuz volume |
| Saudi: Petroline → Yanbu | Pipeline tariff only, Red Sea risk | Same, plus Bab el-Mandeb dependency |
I built a river-flood detection system from scratch on AWS — IoT Core, Lambda, DynamoDB — and the lesson that stuck with me is that "having a detour" and "the detour actually working" are two very different problems. Adding sensors doesn't help if they all route through the same base station. The relationship between Hormuz and Bab el-Mandeb strikes me as structurally similar.
Stockpiles Drawn Down and Rebuilt: Six Months of IEA and SPR Action
What kept prices from spiking further while shipping was jammed was the drawdown of strategic stockpiles.
On March 11, IEA member countries agreed to release 400 million barrels — the largest coordinated release in the agency's history, well above the 182 million barrels released after Russia's 2022 invasion of Ukraine. The next day, the US committed to releasing 172 million barrels from its own SPR over 120 days. Do the math and that lands around mid-July for full completion, and the most recent data suggests the pace largely tracked plan.
IEA members collectively hold about 1.25 billion barrels in government-controlled emergency reserves, plus roughly another 600 million tied to industry-obligation stocks. The 400-million-barrel release amounts to a little over 2% of that combined pool. That's a smaller share than the "largest ever" headline implies — honestly, that surprised me even while writing it.
| Actor | Release size | Agreed/announced | Completion target |
|---|---|---|---|
| IEA members (combined) | 400 million barrels (record, +120% vs. 2022) | March 11, 2026 | Phased by member country |
| US SPR (standalone) | 172 million barrels | March 12, 2026 | ~mid-July 2026 (120 days out) |
| IEA emergency reserve base | ~1.25B government + ~0.6B industry | — | — |
It's worth stressing that reserve releases buy time — they don't fix the underlying supply-demand imbalance. Goldman Sachs estimates Gulf crude exports have recovered to roughly two-thirds of pre-war levels (15-16 million barrels/day), but that reflects rerouting around the bottleneck, not the bottleneck clearing. Those reserves eventually have to be refilled, and which names benefit from that refill cycle is a Part 2 question, not a Part 1 one.
Freight Moved First: Grading the BDTI Signal
In my February 14 piece, I flagged that if the Middle East tanker freight index (BDTI) widened more than 20% over three weeks, it was worth treating as a leading signal ahead of equities. This is my six-month scorecard on that call.
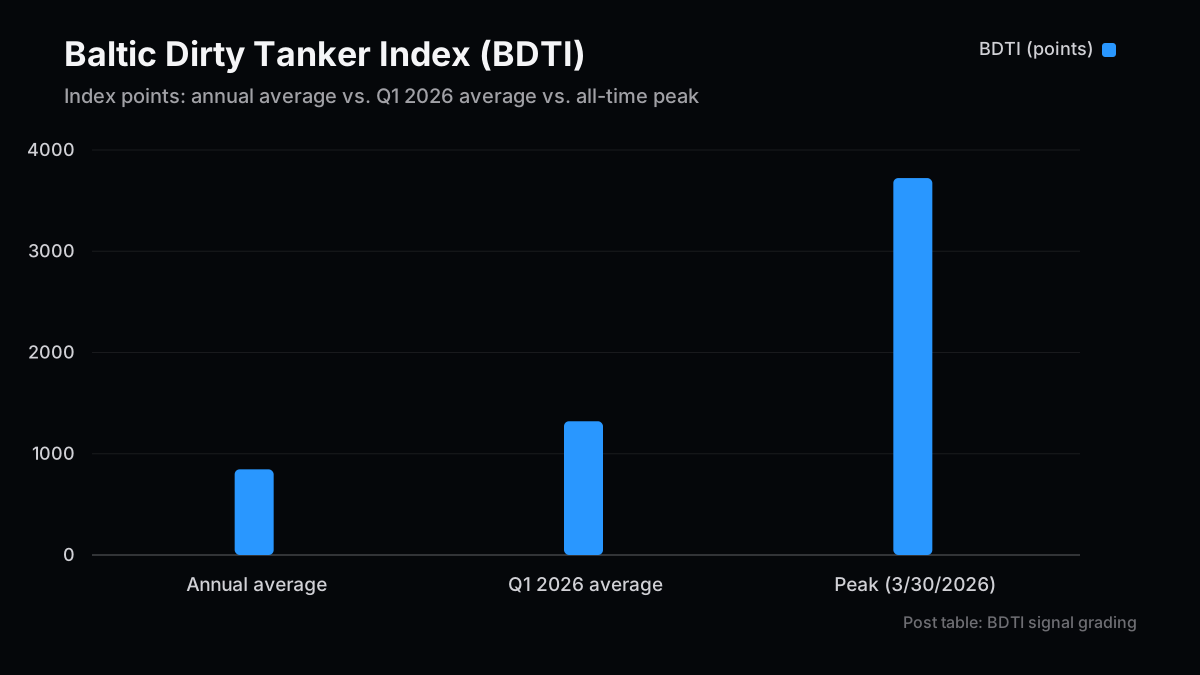
The short version: I was directionally right, but I badly undersold the magnitude. BDTI hit an all-time high of 3,723 points on March 30 — up 230% year-over-year. Q1 2026's average of 1,321 points ran 56% above the full-year average of 846. The "20% widening" threshold I flagged wasn't a warning sign — it was already ancient history within three weeks of the war starting.
VLCC spot rates from the Gulf to China peaked around $200,000 a day. Both the Gulf-China (TD3C) and Gulf-Singapore (TD2) routes held well above their 52-week average of roughly $100,000/day. Frontline (FRO), a tanker operator, hit a 52-week high on the back of it.
| Indicator | Pre-war level | Peak | Grade |
|---|---|---|---|
| BDTI (Baltic Dirty Tanker Index) | Annual average 846pt | 3,723pt (3/30, all-time high, +230% YoY) | Blew through the prior +20%/3wk threshold |
| VLCC Gulf-China spot rate | ~$100k/day (52wk avg) | ~$200,000/day | Worked as a leading signal |
| Frontline (FRO) share price | — | 52-week high | Freight repricing flowed through to equity |
Looking back, my real error wasn't finding the right leading indicator — it was underestimating how far it could run. Next time a chokepoint shock like this shows up, I plan to treat any fixed percentage threshold as a floor, not a ceiling.
Where We Stand: Brent at $86-88 and What's Next
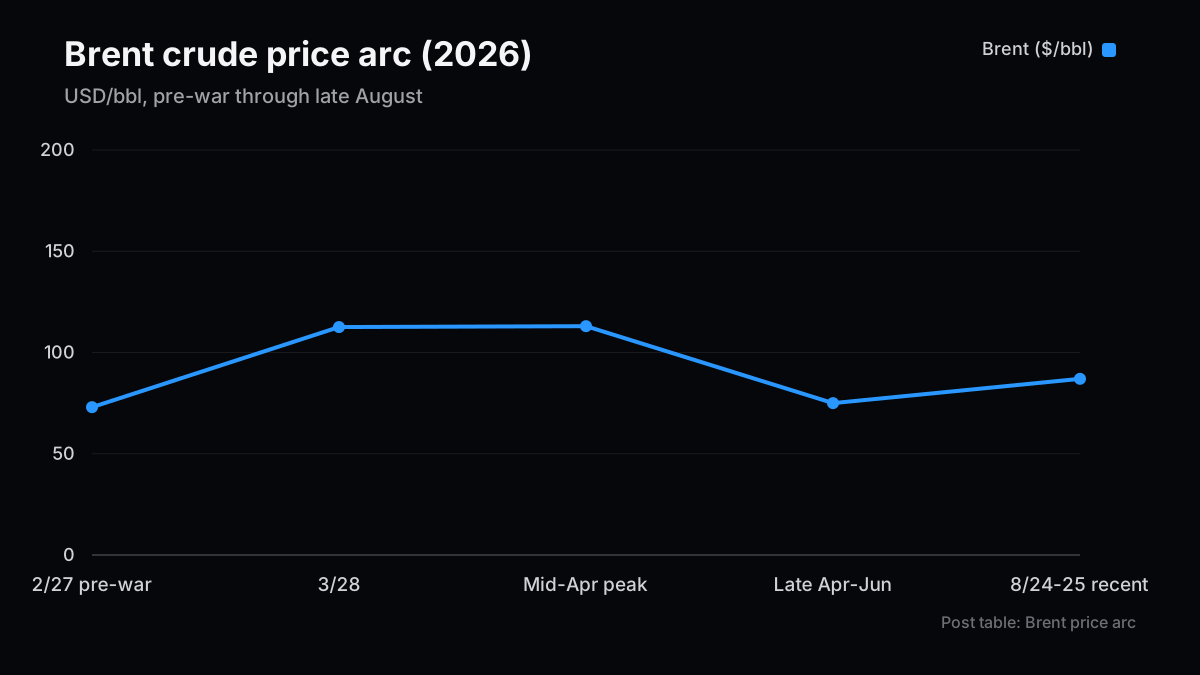
Last, the price picture. Brent moved from $73 pre-war (Feb 27) to $112.57 by March 28, as I covered last time. It then held around $112-115 for a few more weeks before ceasefire hopes in April pulled it back toward $70-80. The most recent print (Aug 24-25) is $86-88 — still above pre-war levels, but roughly 25% off the peak.
| Period | Brent | Context |
|---|---|---|
| 2/27 (pre-war) | $73/bbl | — |
| 3/28 | $112.57/bbl | Hormuz blockade, Qatar LNG facility struck |
| Mid-April | ~$112-115/bbl | Multi-week peak zone |
| Late April-June | $70-80/bbl | Ceasefire and negotiation optimism |
| 8/24-25 (recent) | $86-88/bbl | Aug 25 sanctions read as de-escalatory |
Stepping back over the full six months, both routes and stockpiles have followed the same pattern: break, patch, wobble again. Here's how I'd frame what comes next, across three scenarios.
| Scenario | Description | Brent | Implication for routes/stockpiles |
|---|---|---|---|
| Base: staged normalization | The Iran-Oman corridor framework materializes; transit volumes gradually recover | $80-90/bbl | Cape rerouting shrinks; SPR refill phase begins |
| Main: the cycle continues | The "ceasefire-breakdown-blockade" pattern seen since April repeats again | $90-110/bbl | Rerouting and elevated freight become structurally embedded |
| Tail: full re-escalation | Mining resumes at scale; military escalation returns | $120+ | Insurers pull capacity, freight retests $200k/day |
My own instinct, looking only at the latest headlines, would be to lean toward the base case. But given that we've seen roughly four "ceasefire announced" moments in six months, each unwinding within weeks, weighting the main scenario most heavily feels like the more honest call.
I can't do the ticker-level work justice in this article alone. Tanker operators, marine war-risk insurers, SPR-refill beneficiaries, and LNG alternative supply — that's a Part 2 conversation, and I'll take it up next.
Next Issue Ideas
- Idea 1: The Investment Playbook — Tankers, War-Risk Insurance, and SPR Refill (Part 2) — Building on the route and stockpile data from this piece, a concrete look at tanker operators, marine war-risk insurers, SPR-refill beneficiaries, and LNG alternative supply, with scenario-based positioning.
- Idea 2: Grading the coal call — Revisit the "short-term long, medium-term neutral" call from the March coal piece against actual Newcastle prices and BTU/WHC performance since.
- Idea 3: The marine war-risk insurance cycle — Six months after Lloyd's Hormuz consortium launched, a deeper look at how premium rates have moved and how this kind of cycle typically ends.
Related Posts
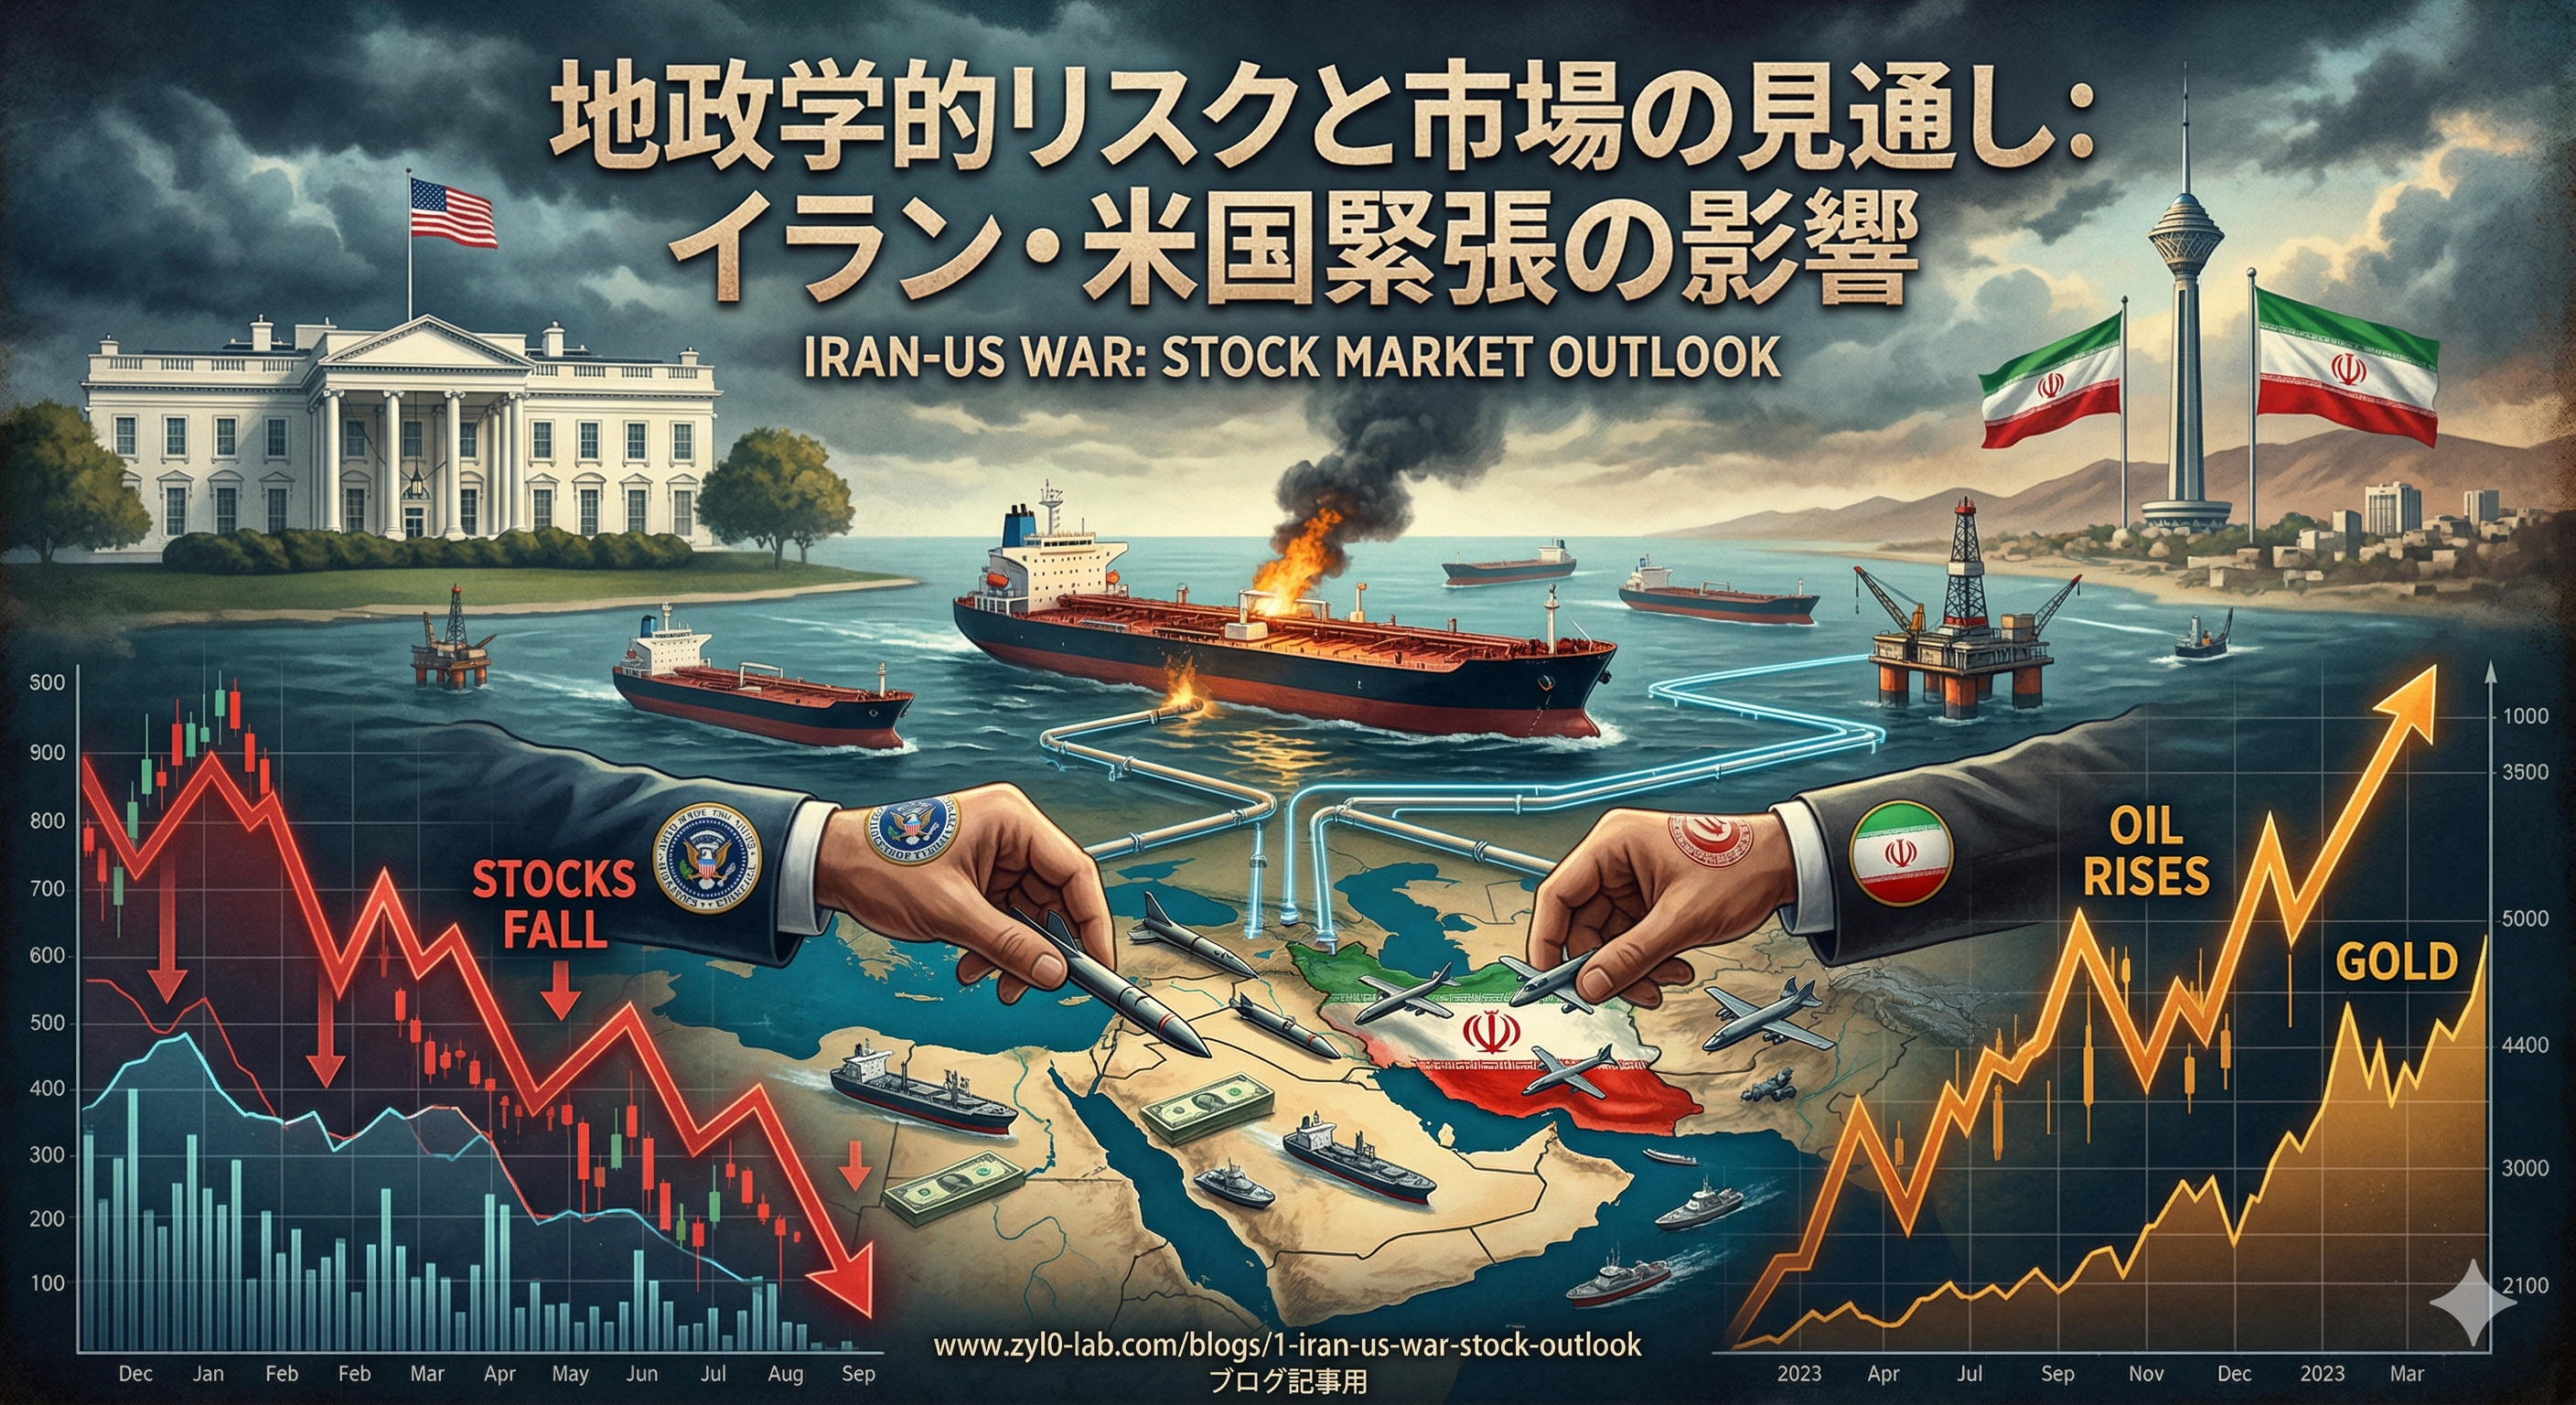
- US Stock Market Outlook: Iran-US Tensions — The Brent-BDTI leading-indicator call from before the war, graded against actual data in this piece.
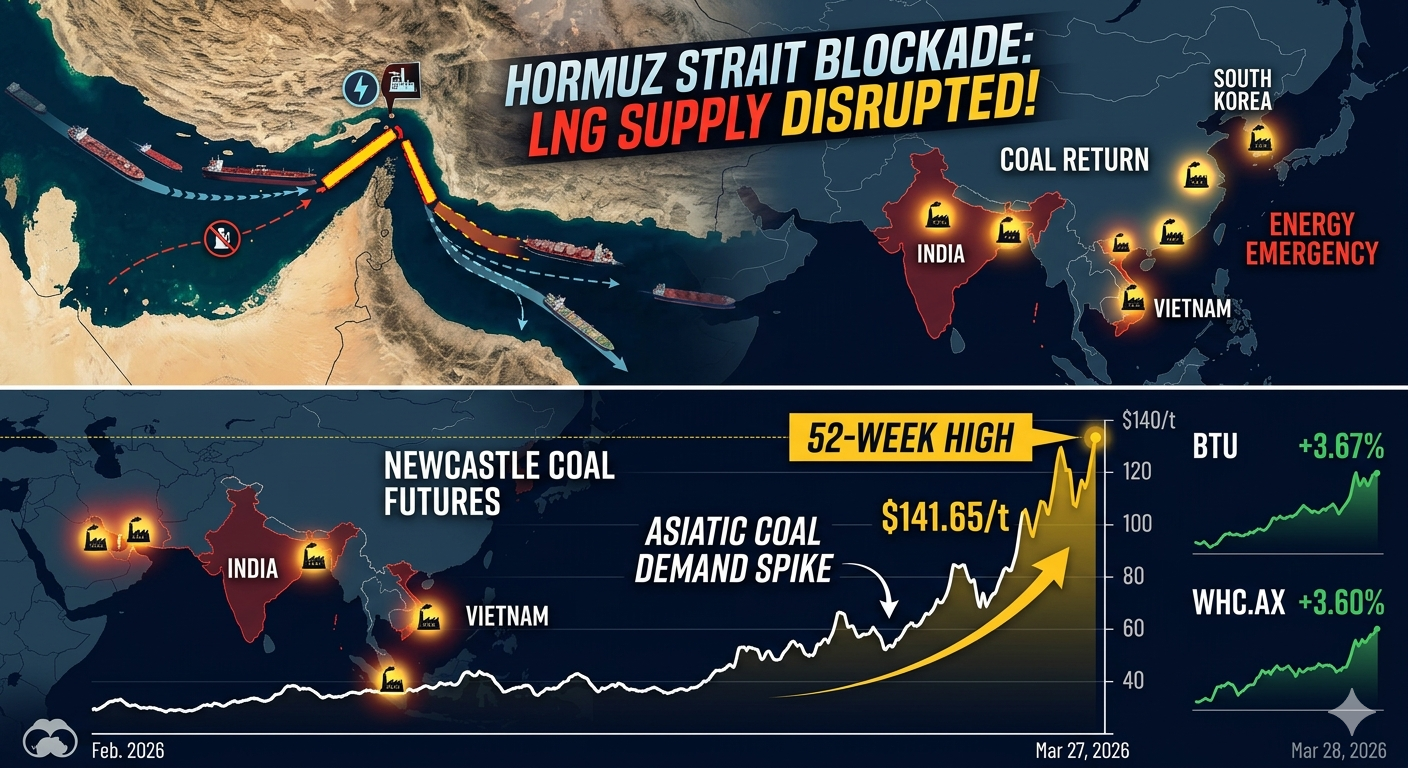
- Iran War Sparks a Reversal in Coal Stocks — The source of the watch points this article resolves, including the April 6 deadline and the IEA's 400-million-barrel release.
- Oil's New Map, Six Months Into the Iran War — Part 2: The Investment Playbook in Tankers, War-Risk Insurance, and SPR Refill — The concrete investment angles and scenario positioning built on this article's data.
References
The factual and numerical assumptions in this article are anchored to primary or public materials that readers can revisit during AdSense review and future updates.
- 2026 Strait of Hormuz crisis (Wikipedia)
- IEA agrees to release 400 million barrels of oil from strategic reserves (Al Jazeera)
- Are ships passing Hormuz more willing to defy Iran or US? What data shows (Al Jazeera)
- U.S. Energy Information Administration oil market data
- IEA member countries oil stock release announcement
This article is for informational purposes only and does not constitute investment advice or a recommendation of any specific stock, service, or contract structure. The author may hold positions or interests related to companies or services mentioned. Generative AI was used for parts of research, translation, and proofreading, with final review by ZYL0. See the disclaimer for details.