Big Tech AI Capex Is Not Comparable As Reported: Restating Four Disclosures on One Definition
Alphabet, Amazon, Microsoft and Meta report capex on four different definitions. Restating one common quarter onto the cash property-and-equipment line changes the ranking, and shows which of them no longer funds it from operating cash flow.

Alphabet, Amazon, Microsoft and Meta report capex on four different definitions. Restating one common quarter onto the cash property-and-equipment line changes the ranking, and shows which of them no longer funds it from operating cash flow.


Big Tech AI Capex Is Not Comparable As Reported: Restating Four Disclosures on One Definition
"Which of them is actually spending the most on AI — Google, Meta, Amazon or Microsoft?" It is one of the most common questions that brings readers to this blog from search. The trouble is that the four numbers the headlines line up on earnings day are not measuring the same thing.
I cannot let that slide, partly out of an old habit. When I moved into corporate venture capital, the investment team had no shared quality standard for investment reviews. People brought memos to the investment committee using their own definitions of "revenue" and "investment", and the comparisons were not really comparisons. I standardised the definitions first. The general lesson holds: until filings from different reporting entities are normalised, ranking them is meaningless.
So let me run that exercise on the four most recent Big Tech disclosures. The short version: restating them onto one definition compresses the gaps, and two of the four did not cover the quarter's capital spending with operating cash flow.
As of 20 September 2026. Figures are taken from each company's earnings release filed with the SEC (Exhibit 99.1) and from Microsoft's FY26 Q4 earnings materials. The comparison quarter is April–June 2026; for Microsoft that is fiscal 2026 Q4, which covers the same calendar period. Ratios are my calculations, not disclosed company metrics.
TL;DR: Four Companies, Four Different "Capex"
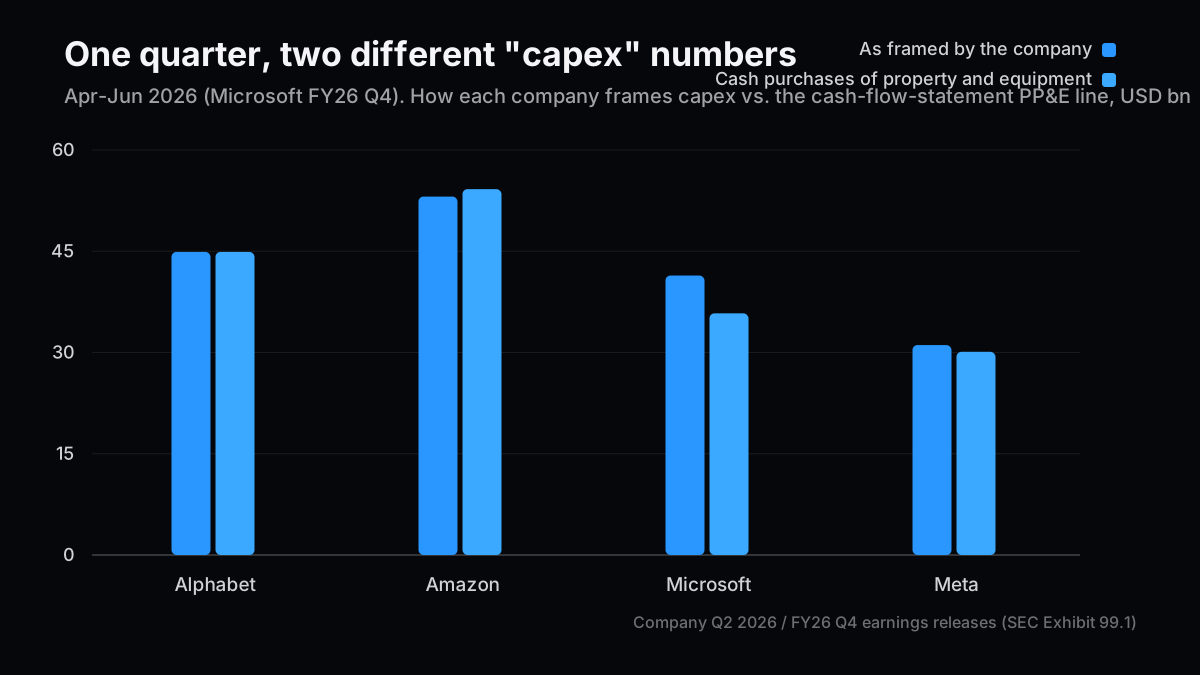
Here is where the definitions diverge.
| Company | Capex as the company frames it | Cash purchases of property and equipment | What sits in the gap |
|---|---|---|---|
| Alphabet | $44.9bn | $44.9bn | No separate finance-lease line in the cash flow |
| Amazon | $53.1bn | $54.2bn | $1.1bn of sale proceeds and incentives netted |
| Microsoft | $41.4bn | $35.8bn | $5.6bn of finance leases added |
| Meta | $31.1bn | $30.1bn | $1.0bn of finance-lease principal added |
Alphabet's $44.9bn is simply its $44.9bn of property-and-equipment purchases with no lease adjustment, so both columns point at the same line. Microsoft is the interesting one. Of the $41.4bn discussed on the call, $5.6bn is finance leases rather than cash out the door, and the cash figure is $35.8bn.
The ordering barely moves — Amazon, Alphabet, Microsoft, Meta on either basis — but the distances do. The gap between Microsoft and Meta narrows from $10.3bn to $5.7bn, roughly by half. "Microsoft is outspending Meta by 1.3x" and "by 1.19x" land very differently on a reader.
In the Q1 2026 comparison I did not give this enough room. The story then was the sheer scale of a combined $600bn, and the definitional point went into a footnote in my head. Six months and a much larger number later, it cannot stay there.
Restating One Quarter on One Definition
The method is deliberately dull. Take only the cash line for purchases of property and equipment from each company's own cash flow statement. Ignore what was said on the call.
| Metric (Apr–Jun 2026) | Alphabet | Amazon | Microsoft | Meta |
|---|---|---|---|---|
| Revenue ($bn) | 119.8 | 200.6 | 90.0 | 60.8 |
| Operating income ($bn) | 40.8 | 27.5 | 40.6 | 18.8 |
| Operating cash flow ($bn) | 39.1 | 45.4 | 55.4 | 31.9 |
| Cash property and equipment | 44.9 | 54.2 | 35.8 | 30.1 |
| Finance-lease principal ($bn) | not disclosed | 0.4 | 5.6 | 1.0 |
The first thing that jumps out is the revenue line. Amazon is 3.3x the size of Meta. Comparing absolute spending across companies of that different a size tells you very little about how heavy the investment is, so the next step is to scale it.
# April-June 2026, USD billions, from each company's earnings release (SEC Exhibit 99.1).
q = {
    "Alphabet":  {"rev": 119.796, "ocf": 39.069, "ppe": 44.924, "lease": None},
    "Amazon":    {"rev": 200.600, "ocf": 45.387, "ppe": 54.208, "lease": 0.395},
    "Microsoft": {"rev":  90.007, "ocf": 55.441, "ppe": 35.802, "lease": 5.600},
    "Meta":      {"rev":  60.801, "ocf": 31.862, "ppe": 30.116, "lease": 0.962},
}

for name, v in q.items():
    intensity = v["ppe"] / v["rev"] * 100
    coverage = v["ppe"] / v["ocf"] * 100
    with_lease = (v["ppe"] + (v["lease"] or 0)) / v["ocf"] * 100
    print(f"{name:10} {intensity:5.1f}% {coverage:6.1f}% {with_lease:6.1f}%")
| Company | Cash capex / revenue | Cash capex / operating CF | Including leases |
|---|---|---|---|
| Alphabet | 37.5% | 115.0% | not disclosed |
| Amazon | 27.0% | 119.4% | 120.3% |
| Microsoft | 39.8% | 64.6% | 74.7% |
| Meta | 49.5% | 94.5% | 97.5% |
By revenue, Meta carries the heaviest load at 49.5% — roughly half of every dollar of sales. Measured against operating cash flow, though, Meta stays just inside at 94.5%, while Alphabet and Amazon are both above 100%. In this quarter, each of them paid out more cash for property and equipment than operations generated.
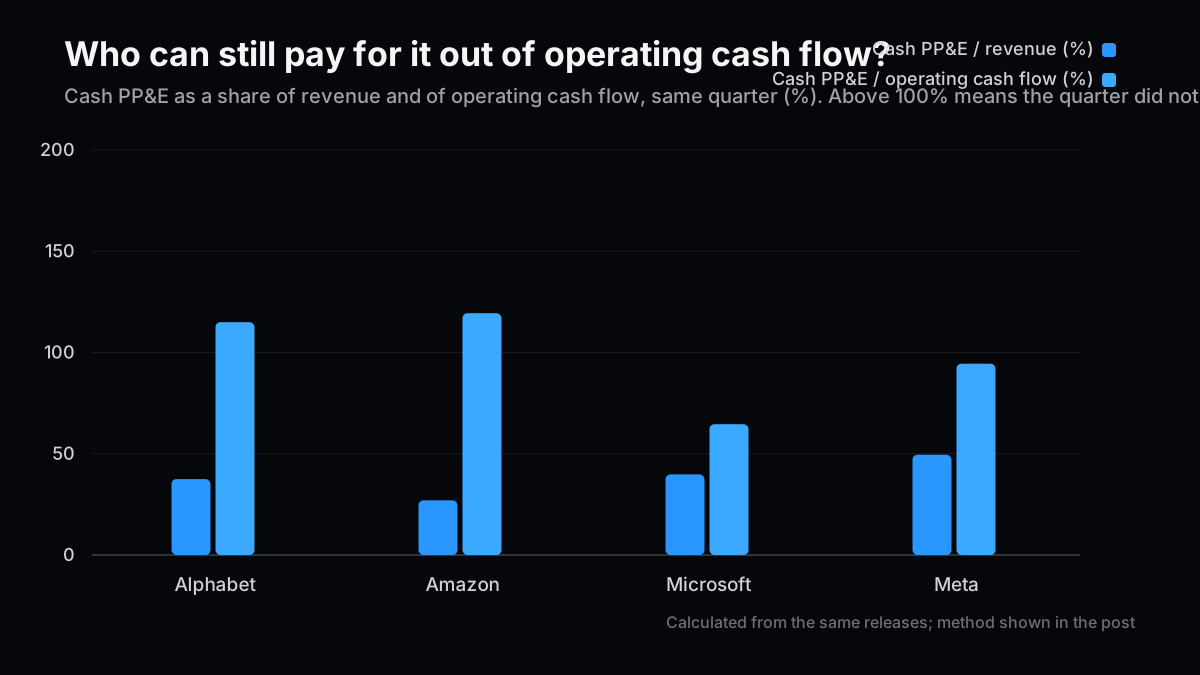
Only Microsoft keeps real headroom at 64.6%, and even that rises to 74.7% once finance leases are added back. This is the part that nags at me. Microsoft is moving more of its future data centre leases from finance leases to operating leases, and operating leases are not included in capex at all. When the definitional line moves, reported capex can fall without a single dollar of real spending changing.
A Different Question: Who Is Still Paying For It Themselves?
Spend enough time on the size of the number and you skip the question of where the money comes from. I stopped here for a while.
Alphabet generated $39.1bn of operating cash flow in the quarter and spent $44.9bn on property and equipment — a $5.9bn shortfall. On its own, that is the kind of gap working capital absorbs. But in June 2026 the company raised net proceeds of $49.6bn in Class A and Class C stock plus mandatory convertible preferred stock, on top of $20.0bn of dollar notes and $31.8bn of foreign-currency notes issued in the first half. The 10-Q states the purpose as general corporate purposes "including capital expenditures to scale AI infrastructure and global compute".
That is the scenario I sketched in the piece on AI capex and rate risk turning concrete. While the spending is self-funded, AI capex is a question about how profits get used. Once external funding enters, it becomes a question about interest rates and dilution.
Comparing profits is just as treacherous this quarter. Alphabet's net income of $112.2bn is 2.7x its $40.8bn of operating income, and most of the difference is roughly $98.0bn of unrealised gains on equity securities. Amazon's $62.6bn of net income includes $53.4bn of pre-tax non-operating income, primarily from its Anthropic investments.
| Company | Operating income | Net income | Main one-off inside net income |
|---|---|---|---|
| Alphabet | $40.8bn | $112.2bn | ~$98.0bn of unrealised equity gains |
| Amazon | $27.5bn | $62.6bn | $53.4bn of non-operating income (Anthropic) |
| Microsoft | $40.6bn | $35.8bn | No comparable one-off disclosed |
| Meta | $18.8bn | $15.8bn | No comparable one-off disclosed |
Running a P/E off reported net income and concluding that Alphabet looks cheap does not work for this quarter. Marking up stakes in AI companies distorts both the numerator and the denominator of the thing we are trying to value.
It also matters that Amazon and Microsoft both attributed part of their raised outlook to memory prices. As the memory lock-in piece argued, procurement prices are increasingly set in multi-year agreements. A capex total cannot tell you whether growth in spending is volume or unit price.
Reading Full-Year Guidance Without Adding Apples to Oranges
If the definitions drift within a quarter, annual guidance drifts further.
| Company | 2026 outlook | Definition | Recent change |
|---|---|---|---|
| Amazon | ~$220bn | Capital investments including finance leases | Raised from ~$200bn |
| Alphabet | $195–205bn | Purchases of property and equipment | Raised from $180–190bn |
| Microsoft | ~$175bn (calendar) | Includes finance leases, after the lease reclassification | Adjusted down by the reclassification |
| Meta | $130–145bn | Includes principal payments on finance leases | Narrowed from $125–145bn |
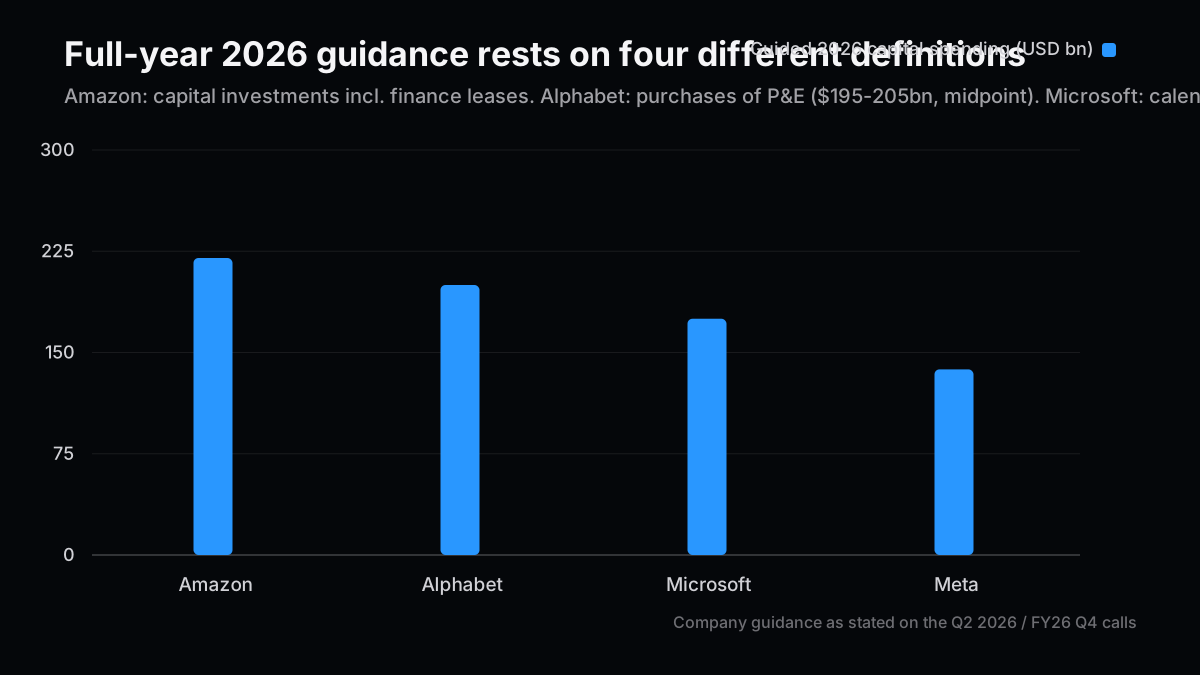
One caveat on that table: Meta is the only one of the four that states its full-year range in the press release itself. The Alphabet, Amazon and Microsoft figures come from their earnings calls, which is not the same standard of disclosure as a reported quarterly number.
Add the midpoints and you get about $732bn. I would not quote that as "what the four are spending on AI". Microsoft's $175bn includes leases and Alphabet's $200bn does not; Microsoft's figure is a calendar year while the others are fiscal. The addition does not hold.
A rough restatement is possible using the Q2 lease share — 13.5% for Microsoft ($5.6bn of $41.4bn) and 3.2% for Meta ($1.0bn of $31.1bn) — applied to the full year. That would put Microsoft near $151bn and Meta near $133bn, for a total closer to $705bn. That is a scenario built on my assumption, not company guidance, and nothing says a single quarter's lease share holds for twelve months.
Three Confusions Worth Naming
Writing this, I caught three things I used to blur together.
- Spending versus cash out. A finance lease is spending, but it is not the same as cash leaving in that period.
- Fiscal versus calendar years. Microsoft's FY26 Q4 is April–June 2026, while its "calendar 2026" guidance covers a different window.
- Amount versus intensity. Absolute rankings track company size. Amazon is the largest spender partly because it is the largest company.
Scenarios, and What Would Change My Mind
Three paths are worth tracking from here.
| Scenario | Condition | Primary source to check | Investment implication |
|---|---|---|---|
| Base | Alphabet's and Amazon's cash-flow shortfall closes in 1–2 quarters | Quarterly operating cash flow versus PP&E purchases | Current assessment stands |
| Main | The shortfall persists and debt or equity issuance becomes routine | Frequency and size of issuance, interest expense | Rate sensitivity rises; price in dilution |
| Tail risk | Definitional change shrinks reported capex while spending does not | Lease classification changes, operating-lease balances | Following disclosed capex alone stops working |
On positioning, I have stopped treating the four as one "AI capex trade". Microsoft, spending about two-thirds of operating cash flow on a cash basis, and Alphabet, which has started raising outside money, carry different kinds of risk at similar dollar amounts. Neutral over the next quarter; over the medium term I would weight toward the names funding it internally.
Here is what would change my mind: if Alphabet and Amazon bring capital spending back inside operating cash flow over the next two quarters without new external funding, my reading that they have entered a financing phase is simply wrong. And if all four begin disclosing cash capex and leases separately, this whole exercise becomes unnecessary — which would be the best outcome.
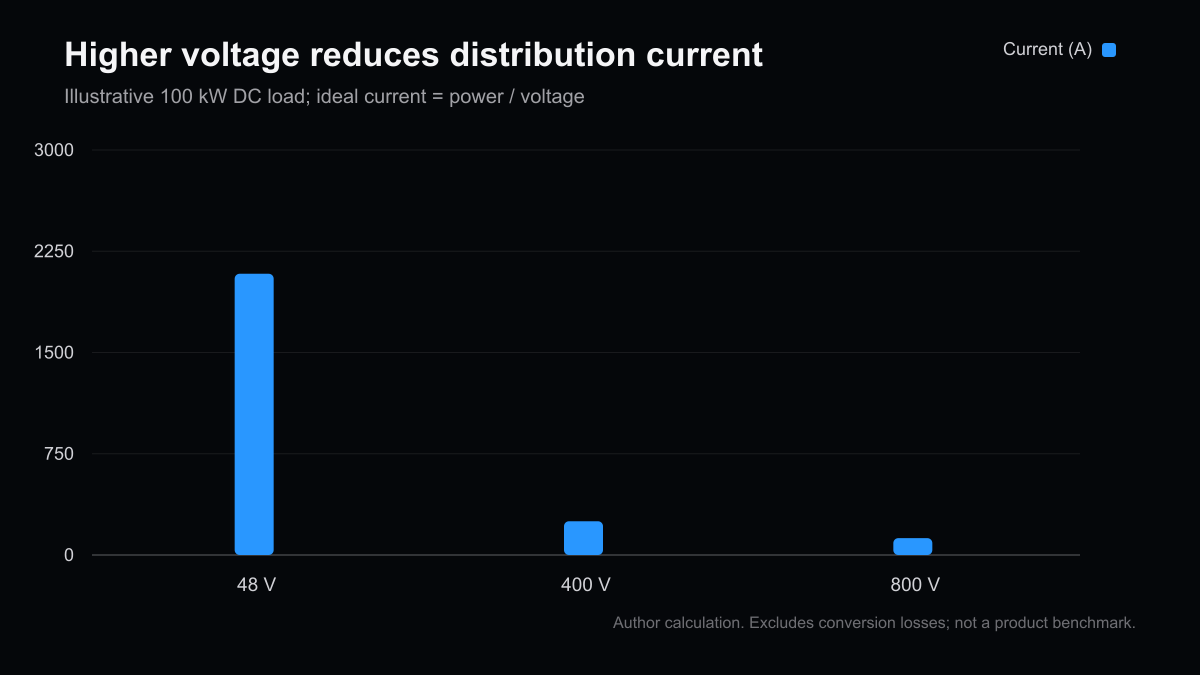
Where the money physically lands — the power equipment covered in the 800V data centre piece, and memory and substrates — is the next layer down. Normalising the dollars is only the entrance.
Related Posts
- Decoding Big Tech Q1 2026 Earnings — the Q1 comparison this post revisits
- AI Capex and Rate Risk for Hyperscalers — what changes once external funding arrives
- 800V AI Data Centers: GaN vs SiC Through Power Losses — where the spending actually goes
Next Issue Ideas
- Idea 1: Tracking the spending that moved into operating leases — Reconstruct, quarter by quarter, how much sits outside disclosed capex using lease balances and future payment schedules.
- Idea 2: P/E without the AI investment marks — Strip the one-off equity gains out of Alphabet's and Amazon's net income and re-run the four valuations on one basis.
- Idea 3: Payback periods implied by depreciation lives — Compare how useful-life changes flow into margins, using only what each company discloses.
References
- Alphabet: Q2 2026 earnings release (SEC Exhibit 99.1)
- Alphabet: Form 10-Q for the quarter ended 30 June 2026
- Amazon: Q2 2026 earnings release (SEC Exhibit 99.1)
- Meta: Q2 2026 earnings release (SEC Exhibit 99.1)
- Microsoft: FY2026 Q4 earnings release (SEC Form 8-K Exhibit 99.1)
- Microsoft: FY2026 fourth quarter earnings conference call
This article is for information only and is not a recommendation to buy or sell any security. The author may hold positions in the companies mentioned. Generative AI was used for research, drafting and translation. Ratios and estimates are calculations based on assumptions stated in the text and do not represent disclosed company metrics or guarantee future financial results. See the disclaimer for details.