Measuring Stock-Market Froth: Reading June 2026 Through the Buffett Indicator, CAPE, ERP, and Concentration
US equity froth in June 2026 measured across four indicators: Buffett Indicator 236%, CAPE 39.6, ERP near zero, and Mag7 concentration at 34%.
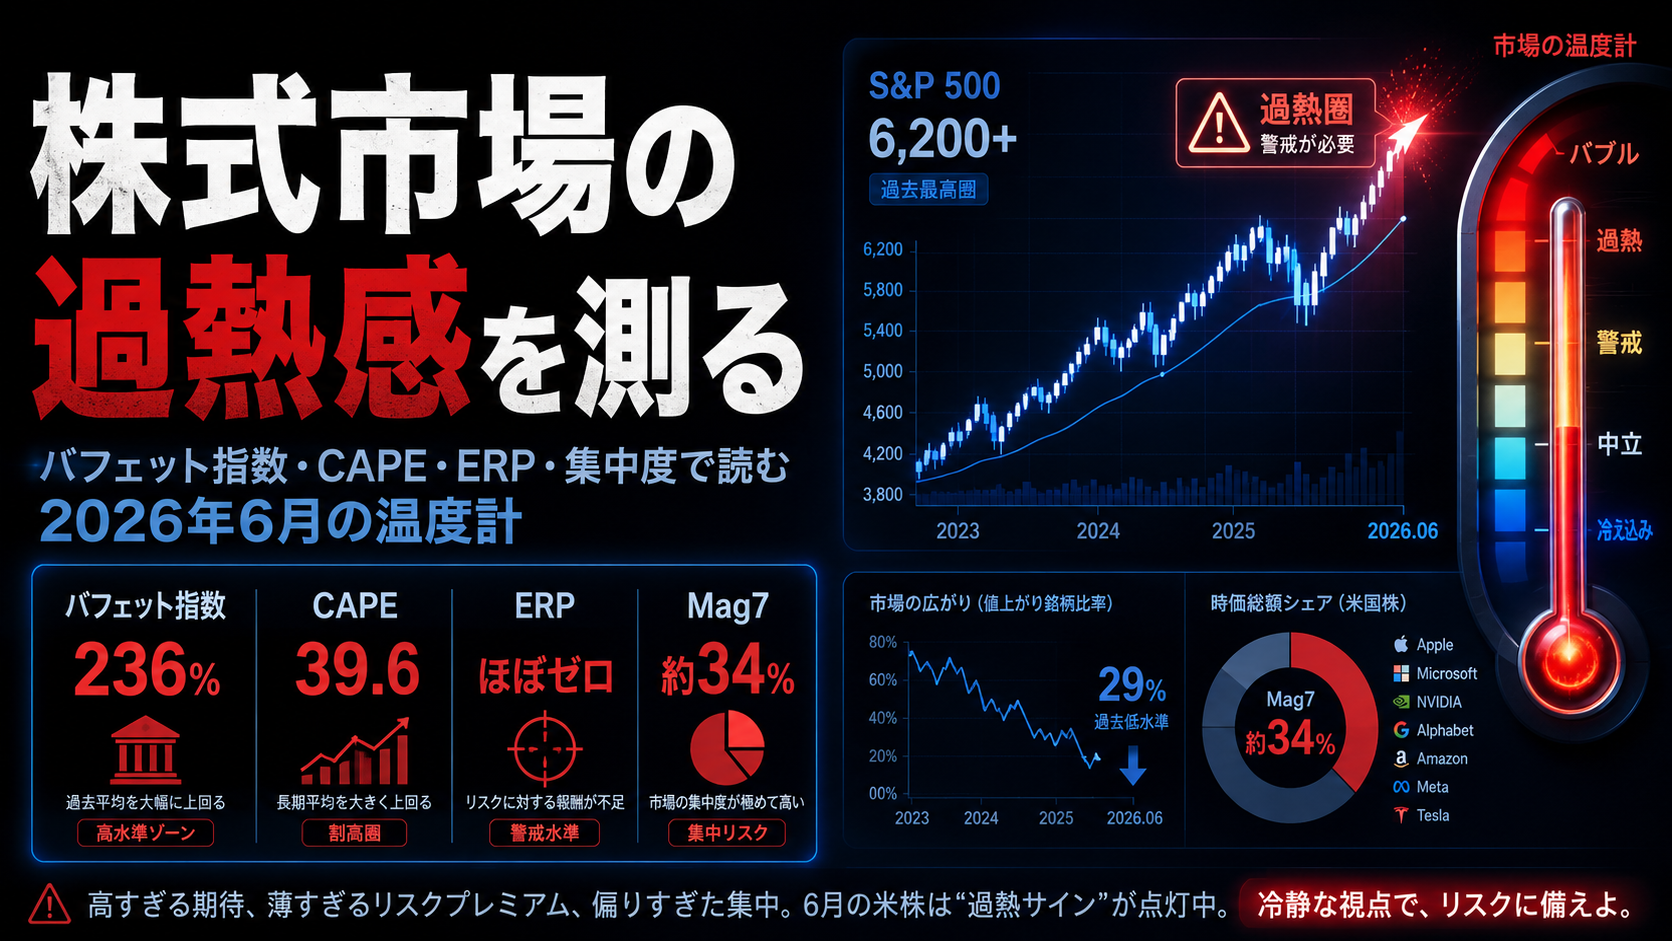
US equity froth in June 2026 measured across four indicators: Buffett Indicator 236%, CAPE 39.6, ERP near zero, and Mag7 concentration at 34%.


Measuring Stock-Market Froth: Reading June 2026 Through the Buffett Indicator, CAPE, ERP, and Concentration
My day job is wrestling with private-company valuations. That is exactly why a market-wide gap between price and fundamentals never feels like someone else's problem. The direct trigger for this piece was a single fact: Berkshire Hathaway — the firm Warren Buffett built — ended Q1 2026 with a record $397.4 billion in cash. Sometimes one number is more eloquent than a hundred indicators.
Let me state my stance up front: this read is cautious and bearish-leaning. I am not saying "it crashes tomorrow." Valuations are at historic extremes, the earnings yield has been caught by Treasuries, and leverage is at a record — yet the index sits near its highs. To me, that makes the risk/reward asymmetric: thin on the upside, thick on the downside. This is a June 2026 thermometer, nothing more.
The Thermometer Is Pinned — A Buffett Indicator at 236%
My first observation: what is striking now is not that one number is high, but that several different rulers are pinned at once.
Start with the facts. The US Buffett Indicator (total market cap ÷ GDP) sits at about 236% as of June 2026. That is 43% above its historical average of roughly 165% and glued to the top of its recorded range (about 33%–238%). It is the second-highest reading in history, exceeded only by the prior quarter. On the original interpretation, that is "significantly overvalued."
The Shiller CAPE (cyclically adjusted P/E) points the same way — about 39.6 in June 2026, closing in on the all-time high of 44.2 and roughly 77% above its long-term trend. Outside the dot-com era and right now, the ratio has not reached this height since the 1870s. What nags at me is that two rulers of entirely different design — market cap to GDP, and ten-year average earnings to price — point at the same extreme. If only one were stretched, I could blame its quirks. When both are pinned, the excuses run out.
Berkshire's cash is the symbol of it. Of the $397.4 billion, about $52 billion is cash equivalents and most of the rest sits in Treasury bills. The firm was a net seller of equities for ten straight quarters from October 2022 to March 2025, shedding over $174 billion net. Apple fell from nearly 50% of the equity book to about 22%; Bank of America was cut by more than half. The behavior itself — "nothing worth buying" — is, to me, the most candid comment anyone has made on index valuation.
| Indicator | June 2026 reading | Historical gauge | My read |
|---|---|---|---|
| Buffett Indicator | ~236% | Avg ~165% | Near all-time high, #2 |
| Shiller CAPE | ~39.6 | Median ~16 / high 44.2 | Dot-com-grade second peak |
| Berkshire cash | $397.4B | Prior peak $381.7B | A "no entry point" testimony |
Before I bundle these, one caveat. These are not timing tools for "when it drops." Expensive can stay expensive for years. What I watch is probability and asymmetry, not the calendar.
The Indicator Dashboard — One Lies, but the Bundle Tells the Truth
A second observation. Every single indicator has a blind spot, so I always read the temperature on two tracks — "valuation" and "sentiment/positioning."
Valuation first. The one that bites hardest here is the ERP (equity risk premium). The S&P 500 earnings yield is about 4.0% in June 2026, against a 10-year Treasury yield of roughly 4.3–4.6%. In other words, the earnings-yield premium for holding stocks over bonds has nearly vanished. An ERP compressed toward zero is something we have not seen since the dot-com bust. "Thin reward for risk, yet record highs" — that contradiction concentrates right here.
| Valuation indicator | June 2026 reading | Implication | What I watch |
|---|---|---|---|
| Buffett Indicator | ~236% | Significantly overvalued | Among the largest vs. GDP ever |
| Shiller CAPE | ~39.6 | Suppressed future returns | +77% above long-term trend |
| S&P 500 forward P/E | ~22× | Elevated | ~4% earnings yield |
| ERP (earnings yield − 10Y) | ~zero | Risk reward gone | Lowest since dot-com |
| Mag 7 market-cap share | ~34% | Concentration risk | Earnings share only ~31% |
Concentration needs one note. The top 10 names hold about 38% of market cap but only ~31% of earnings. So the index's price is paid with a markup on the "future expectations" of a handful of stocks. The Mag 7 trade at ~31× forward, far above the other 493 at ~20×. Buying the index is, in effect, close to buying that small group's high multiple.
Now sentiment and positioning, where a surprising torsion shows up. As of June 26, 2026, the CNN Fear & Greed Index reads 23 (Extreme Fear) and the VIX is 18.89. So structural valuation is at an extreme while short-term psychology has swung to fear. The same day, the Nikkei fell 4.15%. My read: this is a dress rehearsal for how fragile the froth is.
| Sentiment / positioning indicator | June 2026 reading | Implication | What I watch |
|---|---|---|---|
| CNN Fear & Greed | 23 (Extreme Fear) | Psychology cooled fast | Classic post-drop print |
| VIX | 18.89 | Not panic | A lull below 20 |
| Margin debt (FINRA) | Record ~$1.42T | Leverage maxed | +53.7% year over year |
| Net credit balance | Record ~−$991.7B | Borrowing exceeds cash | Kindling for a unwind |
Overlay the two tables and my unease becomes sayable. Valuation at the ceiling, leverage at a record — yet psychology already on the fear side. Normally, greed rules at tops. This time, greed (record margin debt) and fear (F&G at 23) coexist. To me, that combination is the kind you often see in the early phase where froth has crested and begun to cool.
Comparing Japan, and How to Defend — A Map of Overvaluation and Defensive Forms
A third observation. Looking only at the US narrows the field, so I use Japan as a mirror to gauge relative cheapness and richness.
Japan's Buffett Indicator is about 254% — actually higher than the US (236%) and a 20-year peak. But switch to an earnings ruler and the picture flips. The Nikkei 225 trades at a forward P/E of ~16.9× and a CAPE of ~29.4 (early 2026), clearly cheaper than the S&P 500's ~22× forward and ~39.6 CAPE. The Buffett Indicator runs high in Japan because Japanese firms' large overseas earnings inflate market cap relative to domestic GDP — a quirk to discount when reading it.
| Indicator | US (S&P 500) | Japan (Nikkei 225) | My interpretation |
|---|---|---|---|
| Buffett Indicator | ~236% | ~254% | Japan overstated by overseas earnings |
| Forward P/E | ~22× | ~16.9× | Japan cheaper on yield |
| CAPE | ~39.6 | ~29.4 | Froth deeper in the US |
| Recent move (6/26) | Soft | Nikkei −4.15% | Synced to US-froth aftershock |
From here I move to defensive forms. In investment reviews, I have opposed too-high prices with numbers even on good deals. I apply the same discipline to the index. The goal is not to "call it" but to be harder to damage under asymmetric risk. Here is the playbook on one page.
| Defensive form | Concrete tools (examples) | Purpose | My caveat |
|---|---|---|---|
| Raise cash | T-bills, BIL, SGOV | Dry powder + yield | The Buffett move |
| Tail hedge | SPX / SPY put spreads | Crash insurance | Mind VIX-call time decay |
| Thin concentration | Shift to equal weight (RSP) | Less Mag 7 dependence | May lag in a rally |
| Defensive / value | XLP, XLV, XLU, BRK.B | Cycle / rate resilience | Relative defense when rich |
| Real / uncorrelated | Gold (GLD) | Diversify a zero-ERP regime | Inverse to rates short-term |
To be clear, this is not "sell everything and go to cash." What I want to avoid is staying fully long, carrying the whole concentration risk, in a market where the ERP is zero. Paying the cost of insurance to thin the downside — that, to me, is the rational stance in an asymmetric setup.
Scenarios and the Investment Call — Preparing for Asymmetric Risk
A fourth observation. Finally, I tie the indicators above to the scenario where each works, and close with an explicit call. The probabilities are my own.
| Scenario | Probability (subjective) | Story | Indicator implication |
|---|---|---|---|
| Base | 45% | High-level chop, rising vol, rotation | Froth persists, ERP stays thin |
| Soft correction | 30% | A healthy 10–20% pullback resets some froth | CAPE / Buffett Indicator step down |
| Bull continuation | 15% | AI earnings ratify hopes; growth justifies multiples | High multiples partly validated |
| Tail | 10% | Leverage unwind + concentration break → sharp drop | A Mag 7 correction hits the index directly |
My investment call is explicit. Near-term (next 3 months) cautious; medium-term (6–18 months) neutral-to-careful. When valuations are at an extreme, the ERP is near zero, and margin debt is at a record all at once, I do not take risk at full size. But the recent drop and Extreme Fear can also spark a near-term bounce, so I am equally wary of fresh aggressive shorts. The move is not a flashy contrarian bet but a plain adjustment: raise cash, hold a thin tail hedge, and even out concentration.
I close on watch points. If these move, I update the view.
- ERP turning more negative, or the 10Y above 4.7%: equities lose more relative appeal — a likely trigger for a correction.
- Margin debt turning down: the opening move of a leverage unwind; the tail scenario gains odds.
- VIX holding above 20 while F&G fails to recover: a sign the psychology shift is not transient.
- Mag 7's progress on AI capex payback: the heart of whether high multiples can be justified — guidance is my top priority.
- Buffett Indicator below 225%: the first cooling sign; conversely, above 240% the asymmetry worsens further.
Again, this is a June 2026 thermometer. Expensive can persist, and my probabilities can be wrong. Even so, not riding at full size when risk/reward is asymmetric is the plainest, most effective discipline I learned on the CVC floor. I will mark this thermometer to market in six months.
Next Issue Ideas
- Idea 1: Portfolio Design for a Zero-ERP Market — Sizing Cash, Hedges, and Equity by Subjective Probability — Push this post's defensive playbook a step further and back out "how high to raise cash" from scenario probabilities when the ERP sits near zero.
- Idea 2: Dissecting Mag 7 Concentration — Buying the Index Means Buying This Group's 31× — Decompose the gap between the top 10's earnings share and market-cap share, and quantify by sensitivity how far the index moves if concentration breaks.
- Idea 3: Convergence Scenarios for the US–Japan Valuation Gap — Is Cheaper Japan Really a Haven? — Starting from the Buffett-Indicator-vs-P/E torsion, test with data whether Japanese equities act defensively during a US correction.
Related Posts
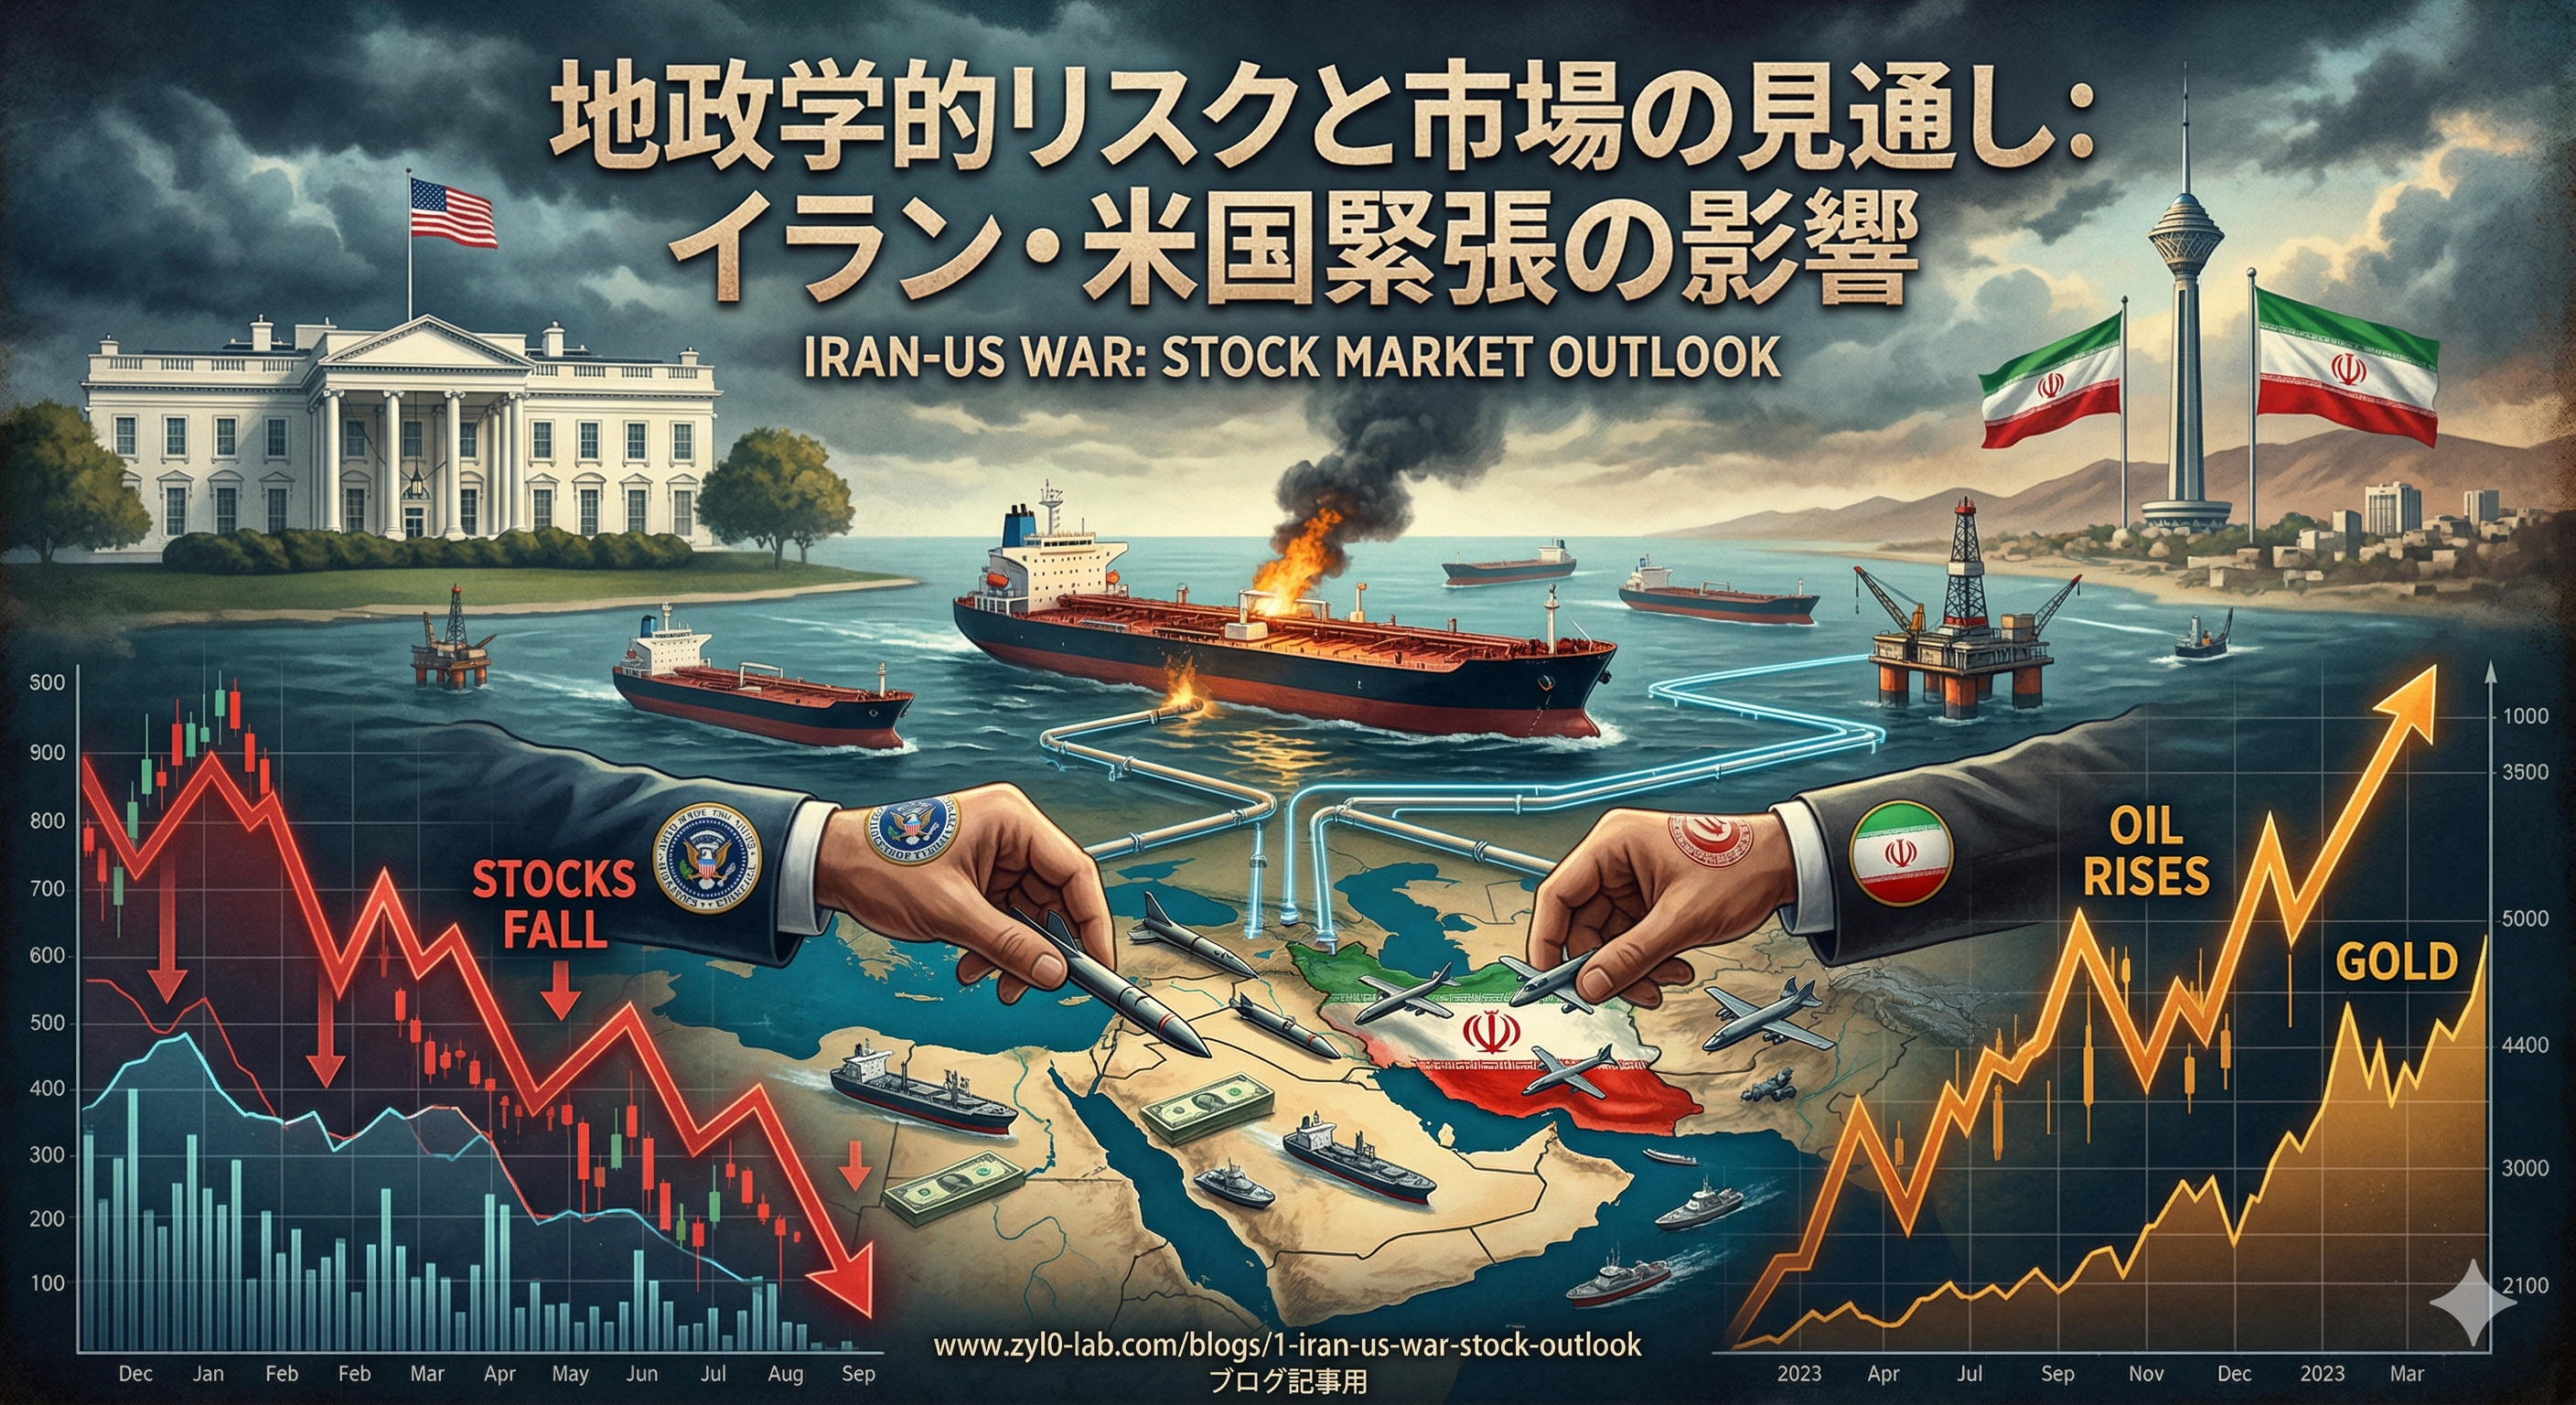
- US Stock Market Outlook: Iran-US Tensions — How escalating US–Iran military tensions reshape the US equity market: revisiting past Middle East crises and current …
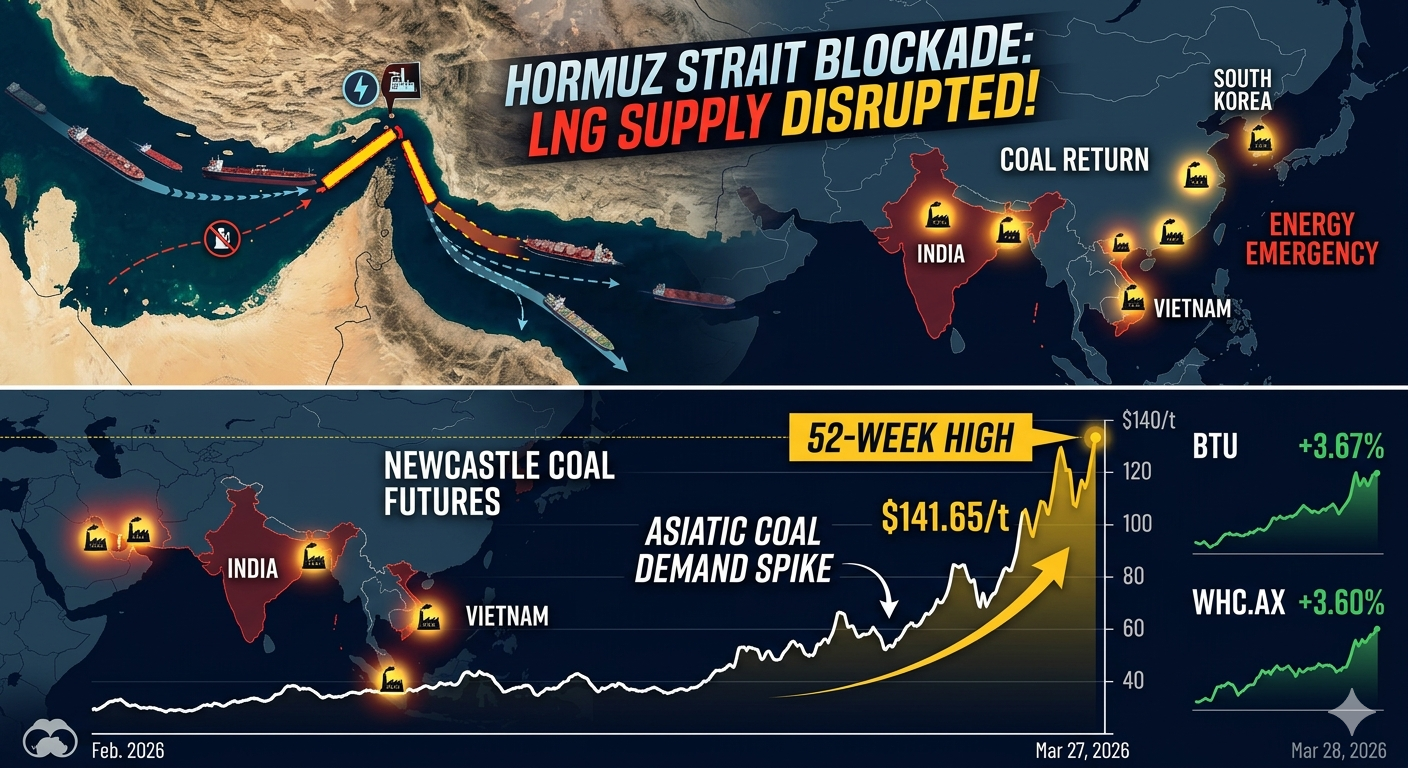
- Iran War Sparks a Reversal in Coal Stocks — With LNG supply choked by a potential Strait of Hormuz blockade, Asia-wide coal demand is surging and Newcastle benchm…
- Decoding Big Tech Q1 2026 Earnings: A Comparative Analysis of Meta, Amazon, Google, and Microsoft — Q1 2026 earnings reveal Big Tech's AI capex showing up in the numbers.
- The Warsh Shock — Part 2: How Far Rate Risk Reaches Into Tech Capex — Builds on this post's valuation-froth read to examine how far rising rates threaten hyperscaler capex.
References
The figures here are anchored to primary or public sources that readers can revisit during review and future updates (as of June 2026). Indicator values vary slightly by source and update date. The probabilities and allocations are the author's subjective view and do not guarantee the future.
- GuruFocus: USA Ratio of Total Market Cap over GDP (Buffett Indicator)
- GuruFocus: S&P 500 Shiller CAPE Ratio
- GuruFocus: S&P 500 Earnings Yield
- Advisor Perspectives (dshort): Margin Debt Jumps 8.5% in May to New Record High
- CNN: Fear and Greed Index
- Fortune: Berkshire's cash pile hits $397.4 billion
- GuruFocus: Buffett Indicator Japan / Global Market Valuation
This article is for informational purposes only and does not constitute investment advice or a recommendation of any specific stock, ETF, or strategy. The probabilities, allocations, and scenarios are the author's assumption-based view and do not guarantee future results. The author may hold positions or interests related to companies or services mentioned. Generative AI was used for parts of research, translation, and proofreading, with final review by ZYL0. See the disclaimer for details.