US Stock Market Outlook: Iran-US Tensions
How escalating US–Iran military tensions reshape the US equity market: revisiting past Middle East crises and current sector sensitivity to recalibrate energy, defense, and safe-haven exposure across scenarios.
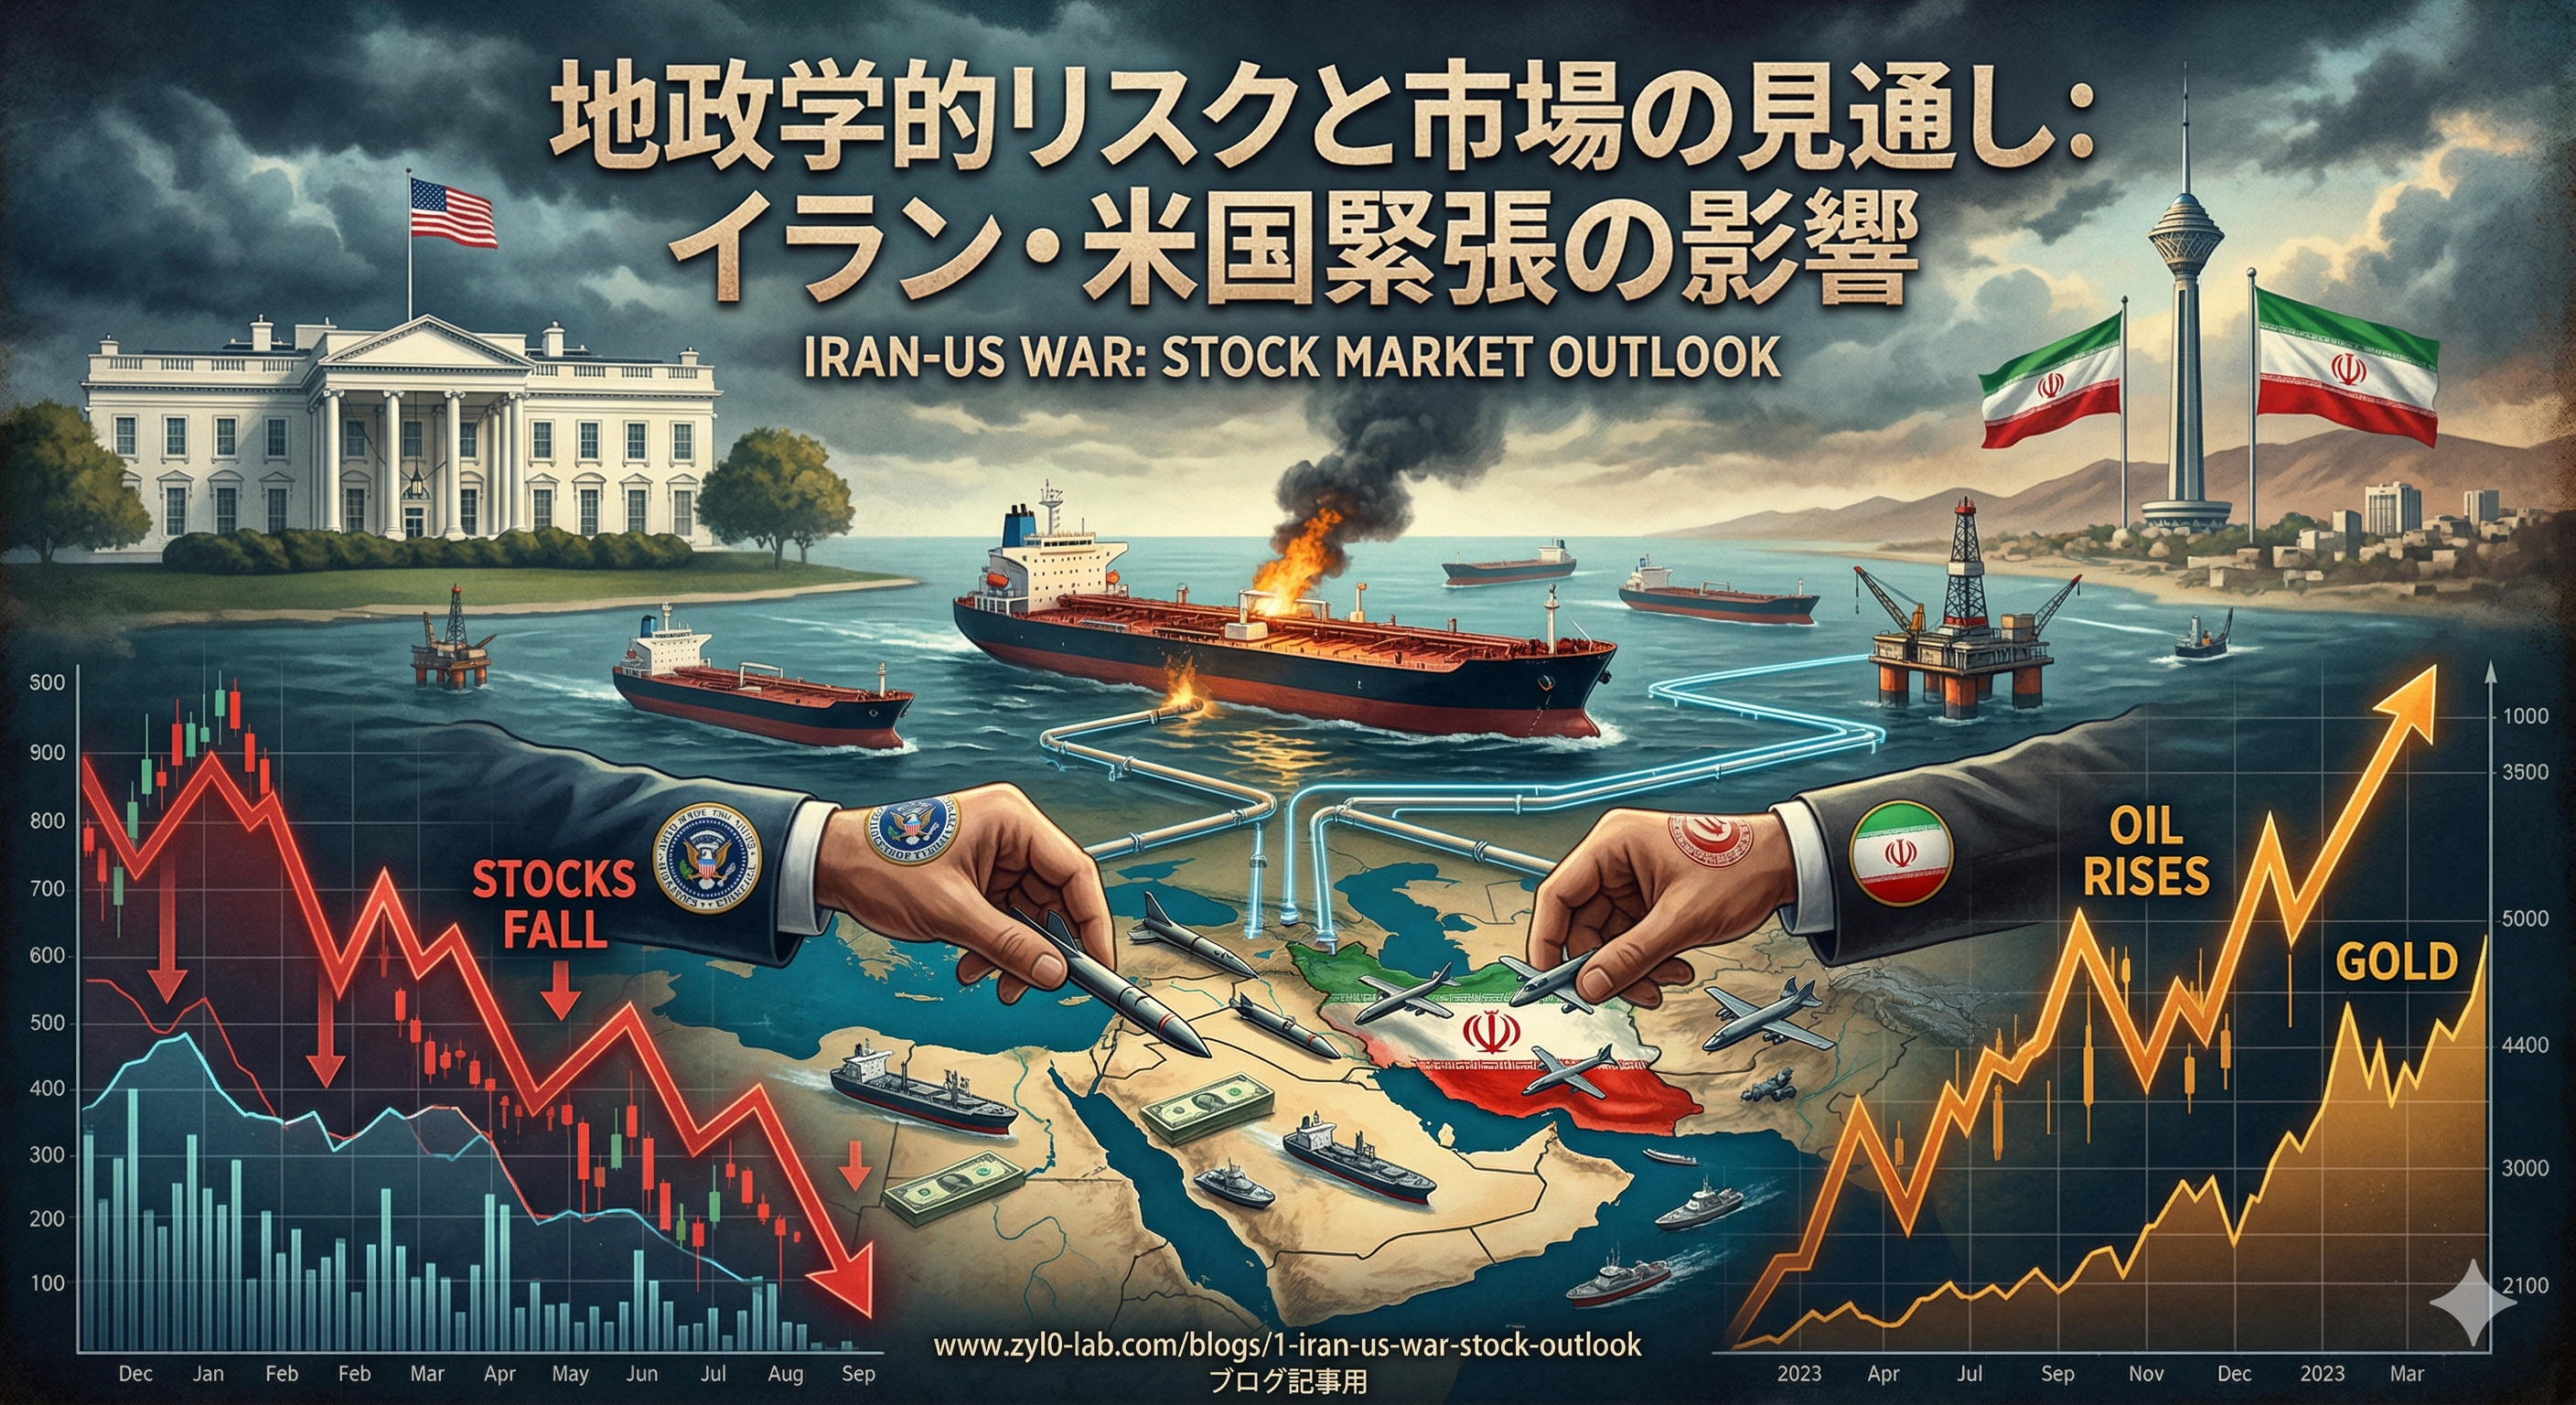
How escalating US–Iran military tensions reshape the US equity market: revisiting past Middle East crises and current sector sensitivity to recalibrate energy, defense, and safe-haven exposure across scenarios.


US Stock Market Outlook: Iran-US Tensions
I've spent years inside a corporate VC analyzing energy deals — From that vantage point, Middle East tensions don't read as a headline story. They read as a single coupled system in which crude, LNG, freight rates, and routing patterns all move together. So when Iran-US tensions flare again, my instinct is to walk through portfolio adjustments with that lens — and that's what this piece is built around.
What the Market's "Middle East Premium" Is Actually Pricing In
Let me first reset the picture flat, before adding any view on top.
Since the JCPOA's collapse, US-Iran relations have settled into a steady-state of "intermittent tension plus limited skirmishes." What's different in 2026 is that several factors have started worsening in parallel, and that's what's lifting the market's risk premium right now.
| Factor | Detail | Market implication |
|---|---|---|
| Iranian nuclear acceleration | Enriched-uranium stockpiles exceeding international red lines | Sanctions tightening → oil & defense bid |
| Strait of Hormuz stress | Strategic chokepoint for ~20% of global oil shipments | Marine insurance & freight rates rising |
| US military buildup | Carrier strike group deployment, regional base reinforcement | Defense-stock momentum |
| Proxy escalation | Houthis, Hezbollah and others ramping up | Supply-chain disruption risk |
| Diplomatic deadlock | No direct talks, indirect channels stalled | Uncertainty premium hard to compress |
The signal I personally weight most is marine insurance pricing. Insurance moves before the headlines do — when VLCC and LNG charter spreads start widening, traders and shipping companies have already adjusted their behavior, and equity markets typically lag that move by several weeks.
What History Teaches About the Shelf Life of Geopolitical Shocks
Geopolitical events look loud, but they have surprisingly short shelf lives in equity markets — that's the first thing you notice when you line them up.
Historical S&P 500 Reactions
| Event | Date | Initial S&P 500 | 3 months | 1 year |
|---|---|---|---|---|
| Gulf War outbreak | Aug 1990 | −17% | −5% | +27% |
| 9/11 attacks | Sep 2001 | −12% | −15% | −12% |
| Iraq War start | Mar 2003 | +3% (rallied on start) | +15% | +33% |
| Iran nuclear crisis | Feb 2012 | −3% | +9% | +22% |
| Soleimani assassination | Jan 2020 | −0.5% | +4% | +17% |
Three patterns:
- Initial shock selloff — short-term decline around the outbreak
- Sharp rebound once uncertainty lifts — the moment "war begins" is paradoxically a removal of uncertainty, and markets usually rally
- Long-term resilience — nearly every case shows positive returns one year out
The relationship I think gets undersold is the near-inverse correlation between initial drawdown and 1-year return. With the exception of 9/11, the bigger the initial shock, the bigger the year-out gain. Periods of peak fear tend to function as long-term entry windows — that's a reasonably stable pattern, not a fluke.
Sector Sensitivities, Re-checked
The same sector cast tends to show up every time. What changes is which player benefits most.
Sectors that benefit
Energy (oil & natural gas)
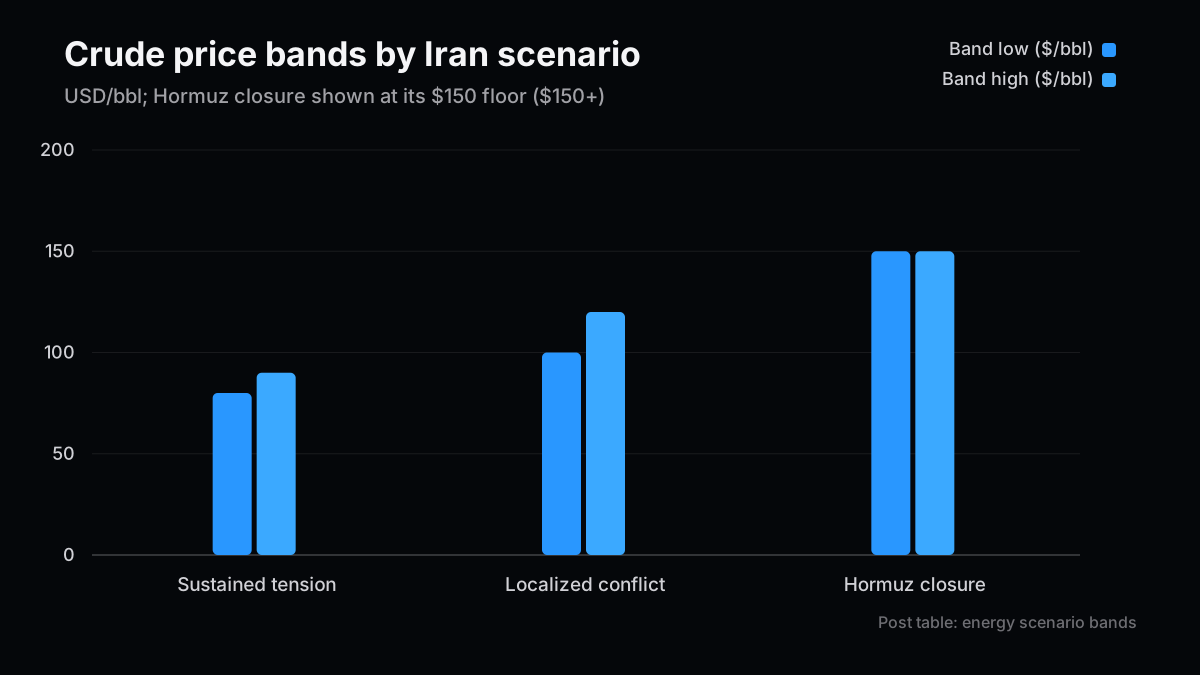
If the Strait of Hormuz becomes even partially unreliable, the entire oil price band resets higher. Having spent a lot of time staring at LNG freight curves, my intuition is that the part of the chain most likely to re-rate this cycle isn't shale upstream — it's the transport, terminal, and liquefaction layer where bottleneck pricing sits.
| Scenario | Crude band | Beneficiaries |
|---|---|---|
| Sustained tension | $80–90/bbl | ExxonMobil, Chevron |
| Localized conflict | $100–120/bbl | ConocoPhillips, Pioneer, Cheniere |
| Hormuz closure | $150+/bbl | US shale upstream + LNG export infra |
Defense & aerospace
This is the most textbook of the cohort. From the CVC seat I've watched defense-adjacent startups during prior tension spikes, and the most consistent pattern is contracting cadence: bookings get pulled forward, and that shows up early in revenue prints.
- Lockheed Martin (LMT) — F-35, missile defense
- RTX — precision-guided munitions, air defense
- Northrop Grumman (NOC) — strategic bombers, space defense
- L3Harris (LHX) — comms, electronic warfare
Gold & precious metals
Gold catching a geopolitical bid is consensus. What I think is less appreciated this cycle is that gold's correlation with real rates has weakened — central bank buying has put a structural floor under demand, so gold doesn't crack as easily when long rates rise. Newmont, Barrick, and GLD increasingly behave like a core allocation, not just an insurance line.
Sectors facing headwinds
Airlines & travel
Suspended Middle East routes plus higher fuel costs is a clean double hit. Fuel runs 25–30% of operating costs, and once crude clears $120, unhedged carriers tend to compress operating margin by 3–5 points within one or two quarters.
Consumer goods & retail
The oil-price ripple arrives late. From what I've seen, thin-margin retail typically shows gross-margin damage on a 3–4 quarter lag, which is exactly the trap — the first earnings print "looks fine," and that lulls people into staying long. The right cut is brand pricing power vs. commodity retail.
High-growth tech
Higher long rates compress high-multiple growth stocks — that's the textbook. The wrinkle this cycle is the AI capex cohort. Geopolitical stress strengthens the incentive to over-stock inventory, which means semiconductors can paradoxically benefit short-term, even within a "tech" basket. Selling the whole growth tape indiscriminately is the easiest way to lose money in this regime.
Market Indicators to Watch
Numbers are the cheapest way to keep your head clear when the news cycle gets loud.
| Indicator | Meaning | Alert level |
|---|---|---|
| VIX (fear index) | Market anxiety | 25+ = caution, 40+ = extreme fear |
| WTI crude | Energy supply/demand | $100+ revives stagflation risk |
| Gold price | Safe-haven demand | $2,500+ = strong flight to safety |
| 10-year Treasury yield | Risk appetite | Sharp drop = recession fears |
| USD/JPY | Global risk-off signal | Yen strength = broad risk aversion |
The instrument I personally watch first is actually the Brent–BDTI spread: when the Middle-East tanker rate index gains more than 20% in three weeks, equity-market sensitivity steps up sharply. It's a useful "off-screen" leading indicator.
Scenario-Based Strategy
CVC discipline says you build for three scenarios — base, main, tail — and adjust as the road forks.
Scenario allocation matrix
| Scenario | Probability (my view) | Energy | Defense | Gold ETF | Tech | Cash |
|---|---|---|---|---|---|---|
| A. Sustained diplomatic tension | 55% | +5–10% | +3–5% | +2–3% | slight under | flat |
| B. Localized military conflict | 30% | +10% | +10% | +5% | −5% | +5% |
| C. Full-scale war (tail) | 15% | broad commodities | +12% | +5–7% | −10–15% | 20–30% |
Scenario A — Sustained tension (base)
Uncertainty persists, no full-scale conflict. Add 5–10% energy, 3–5% defense, 2–3% GLD; trim tech modestly toward dividends and defensives. This is the path I currently weight highest.
Scenario B — Localized conflict (main risk)
Limited Hormuz clashes or strikes on US installations. Volatility steps up — but VIX spikes only become buying opportunities if you've pre-committed to a plan, which historical drawdowns repeatedly remind us. Add to oil & LNG, push defense above 10%, take down equity exposure broadly, rotate into short Treasuries and gold.
Scenario C — Full-scale war (tail)
Low probability, large impact, so it has to be carried as a hedge. Cash 20–30%, geographic diversification (Europe, Asia), broader commodity exposure, and options for downside hedging.
The ZYL0 Investment Call & Watch Items
In one line: short-term neutral-to-defensive, medium-term staged buyer on dips.
What history reliably shows is that geopolitical risk is a short-term trial for equity markets, not a long-term defeat. The lesson I keep coming back to from CVC work is that the investors who beat panic are the ones who pre-committed to a plan and executed it mechanically — emotional outperformance is rarely real outperformance.
Watch items going forward
- Middle East tanker rates (BDTI) — does the index expand >20% over a three-week window?
- US 10-year yield — does it stay sticky above 4.5%? (Repricing trigger for gold and tech)
- US defense budget supplements — does Congress start moving incremental authorizations? (Defense-sector upgrade trigger)
- OPEC+ response speed — is there enough spare capacity to offset Iranian-supply disruption?
This is risk to manage actively, not to flee. That framing — and the discipline to act on it — is, to me, what separates investors who survive Middle-East cycles from investors who get repeatedly chopped by them.
Next Issue Ideas
- Idea 1: A data-updated follow-up — Revisit the thesis with fresh numbers and separate what strengthened from what broke.
- Idea 2: A practical template edition — Turn the article into a checklist readers can reuse for investing, pricing, or technical operations.
- Idea 3: The bear-case test — Define the conditions that would invalidate this view and map the indicators to watch next.
Related Posts
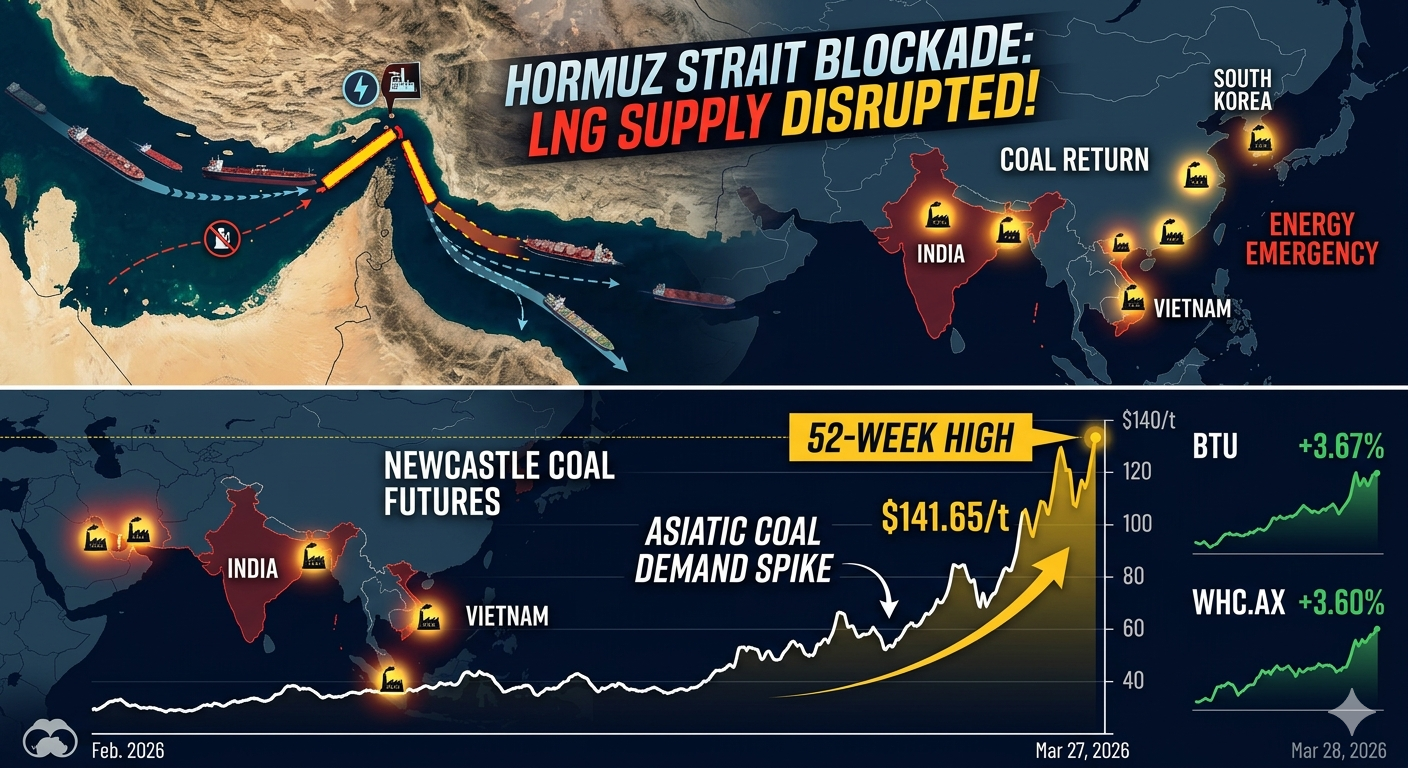
- Iran War Sparks a Reversal in Coal Stocks — How the Hormuz blockade pushed Asia back to coal, read through freight, storage, and contracts.
- Oil's New Map, Six Months Into the Iran War — Part 2: The Investment Playbook in Tankers, War-Risk Insurance, and SPR Refill — Grades this post's Brent-BDTI leading-indicator call against six months of data and builds it out into a tanker and marine-insurance investment thesis.
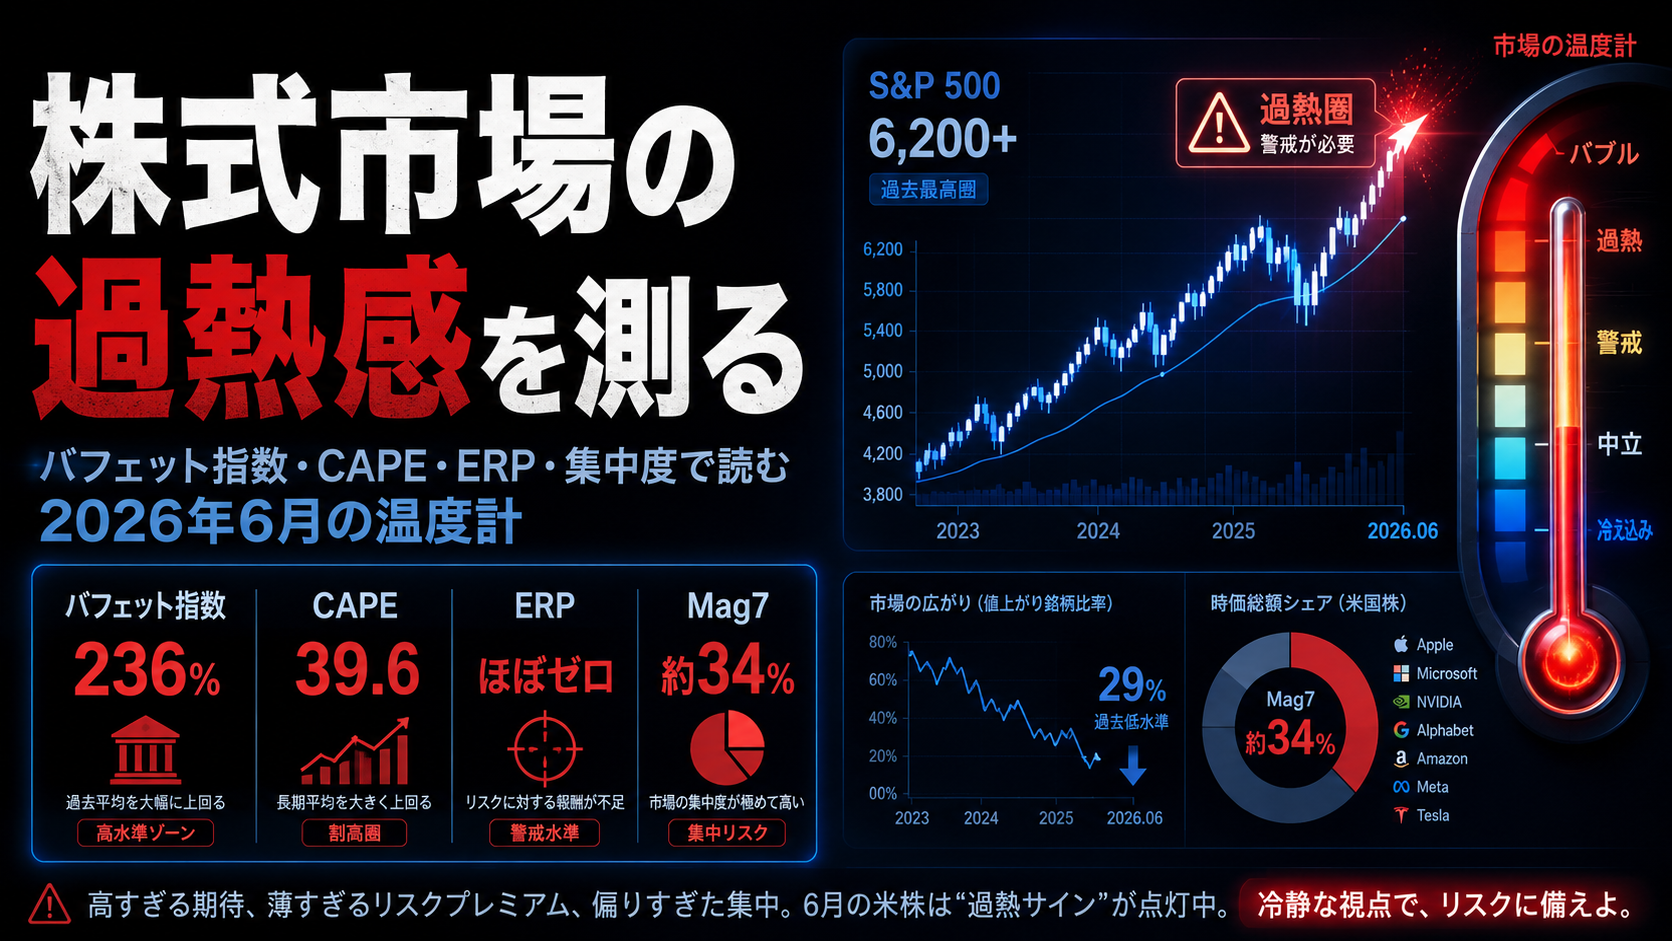
- Measuring Stock-Market Froth: Reading June 2026 Through the Buffett Indicator, CAPE, ERP, and Concentration — Quantifies how stretched US equity valuations are beneath this geopolitical stress test.
- The Warsh Shock — Part 1: How Jackson Hole Rewired the Rate and Dollar-Yen Outlook — Carries this post's dollar-yen risk-off framing forward into a post-Jackson-Hole positioning analysis.
References
The factual and numerical assumptions in this article are anchored to primary or public materials that readers can revisit during AdSense review and future updates.
- U.S. Energy Information Administration oil market data
- Federal Reserve FOMC statements and market context
- U.S. Treasury sanctions programs and country updates
This article is for informational purposes only and does not constitute investment advice or a recommendation of any specific stock, service, or contract structure. The author may hold positions or interests related to companies or services mentioned. Generative AI was used for parts of research, translation, and proofreading, with final review by ZYL0. See the disclaimer for details.