Kharg Island, the Single Point of Failure: How Terminal Concentration Creates Asymmetric Oil Risk
Parts 1 and 2 treated the Hormuz Strait as the risk. Part 3 shifts to Kharg Island, the single loading terminal handling 94 percent of Iranian crude exports, and the asymmetric risk concentration creates.
Parts 1 and 2 treated the Hormuz Strait as the risk. Part 3 shifts to Kharg Island, the single loading terminal handling 94 percent of Iranian crude exports, and the asymmetric risk concentration creates.


Kharg Island, the Single Point of Failure: How Terminal Concentration Creates Asymmetric Oil Risk
Less than two weeks after finishing Parts 1 and 2 of this series, the next data point landed. On September 5, reports of explosions near Kharg Island started circulating, and my honest first reaction was "again?" But this one is a different animal. It is not about Hormuz transit volumes. What was reportedly targeted was not the strait at all — it was a single loading terminal sitting on one island.
Parts 1 and 2 examined the risk sitting in the shipping lane — the Strait of Hormuz. Even with transits down 90%, there was an escape valve: the Cape of Good Hope reroute, and stockpile releases to buy time. This latest episode is narrower and sharper. Hormuz is a diffuse risk spread across hundreds of vessels. A loading terminal is a single point. That distinction matters enormously for how an investor should think about this, and this piece is built around unpacking exactly what kind of asymmetry that concentration creates.
What Happened Near Kharg Island on September 5
What actually caught my attention first was not the substance of the claims but how inconsistent the sourcing was.
Iran's semi-official Tasnim news agency reported that a small tanker was struck near Kharg Island's anchorage by "four US missiles," with no casualties and the crew evacuating. Fars, another Iran-linked outlet, reported only that explosions were heard, with no smoke confirmed and the cause undetermined. There has been no official statement from the Iranian government, and US Central Command has not responded to requests for comment. Whichever account you believe, the numbers are circulating without a confirmed primary source underneath them — that is the actual state of play as of September 5.
Four days earlier, on August 31, President Trump posted a video, apparently AI-generated, claiming Kharg Island had been "blown to smithereens." Reuters found no evidence supporting the claim, and the CEO of Iran's state oil company (NIOC) dismissed it as "laughable." That same day, Brent crude rose 2.95% to $90.70. The gap between an exaggerated destruction claim and the actual size of the price reaction tells you something about how much of this episode is information warfare rather than confirmed physical damage.
| Date | Event | Verification status |
|---|---|---|
| Aug 31 | Trump posts a video, apparently AI-generated, claiming Kharg Island was destroyed | Reuters found no supporting evidence; NIOC denied it |
| Aug 31 | Brent crude rises 2.95% to $90.70 | Confirmed via market pricing |
| Aug 31 | Hormuz transits fall to roughly 3 vessels a day (vs. ~85 pre-war baseline), ~335 ships anchored | Reported observational data |
| Sep 5 | Explosions heard near Kharg's anchorage; Tasnim reports a small tanker struck | No official confirmation from Iran or US CENTCOM |
| Sep 5 | Fars reports explosions only, no smoke confirmed, cause undetermined | Contradicts the Tasnim account |
Building this table drove home something I hadn't fully registered until I laid it out: right now, how an event gets reported is doing more work moving markets than the actual, confirmed scale of damage. The Hormuz transit collapse to roughly 3 vessels a day is a larger deterioration than the roughly 12 vessels a day I flagged as the mid-August average in Part 1, and honestly, I think that quieter number is the more consequential development.
The March Precedent: Military Targets, and Brent Still Cleared $100
Let me rewind six months, because evaluating this episode needs a reference point.
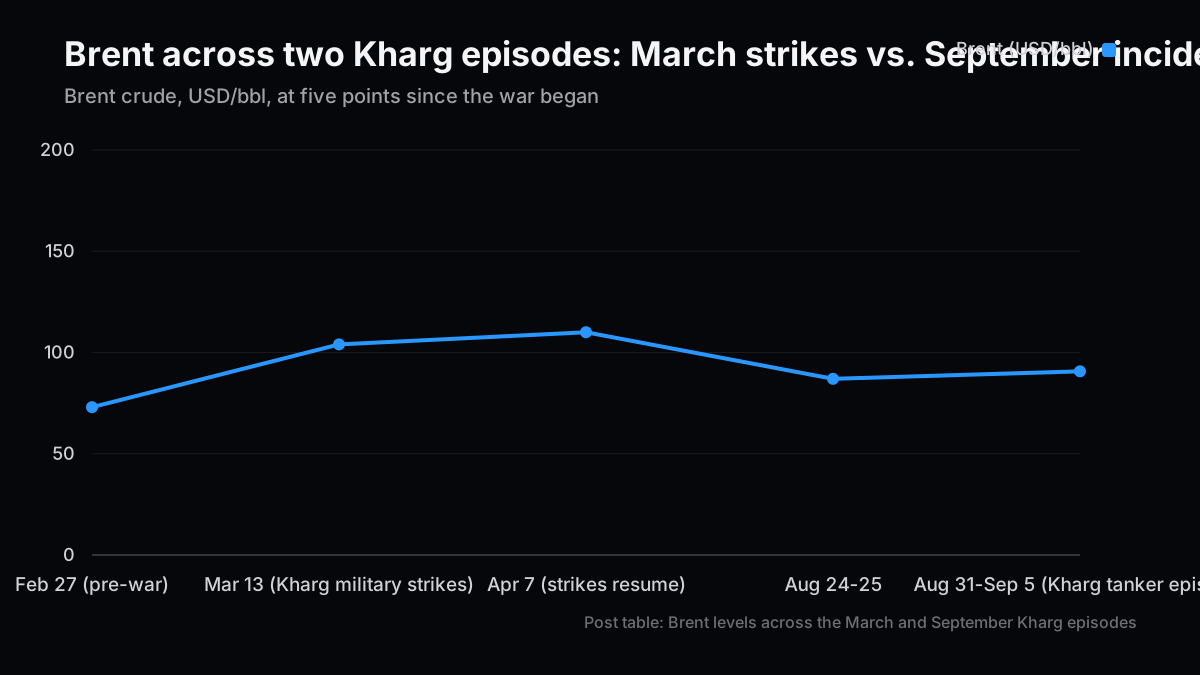
On March 13, US forces struck more than 90 Iranian military sites near Kharg Island — bunkers, radar installations, and ammunition depots. Oil export infrastructure was deliberately spared. Even so, Brent's gain since the war began in late February exceeded 40%, pushing it past $100 a barrel; CNBC's reporting put the mid-week level around $104. The strikes resumed in similar form on April 7, when Brent ran up to roughly $110 and WTI to roughly $115. Again, oil infrastructure was left untouched — satellite imagery days later reportedly still showed three tankers moored at the terminal.
In other words, March and April demonstrated that striking only military assets, while merely gesturing at the possibility of hitting oil infrastructure, was enough to push Brent above $100. The September 5 episode has a different shape. What was reportedly targeted was not a military installation but a small commercial tanker sitting at anchorage. As far as I can verify from the reporting I've reviewed, there is no confirmation that the core terminal infrastructure itself sustained damage.
| Period | Brent | Target |
|---|---|---|
| 2/27 (pre-war) | $73/bbl | — |
| 3/13 (Kharg military strikes) | ~$104/bbl | Bunkers, radar, ammo depots (oil infrastructure spared) |
| 4/7 (strikes resume) | ~$110-115/bbl | Same pattern, oil infrastructure spared again |
| 8/24-25 | $86-88/bbl | — (established level from Parts 1 and 2) |
| 8/31-9/5 (Kharg tanker episode) | ~$90.70/bbl (+2.95%) | Small tanker at anchorage (unconfirmed) |
Is that really the right read? The current level ($90.70) sits well below the March-April peak ($104-115). It would be premature to conclude "this one doesn't matter." My reason for hesitating there is the subject of the next section: the target is edging, incrementally, from "military installation" toward "something closer to the export infrastructure itself." That drift in what's being targeted matters more than the current price level does.
Why the Terminal Is More Asymmetric Than the Strait
This is the core argument of this piece. The Hormuz risk from Parts 1 and 2 and the Kharg risk look similar on the surface, but they have entirely different statistical properties.
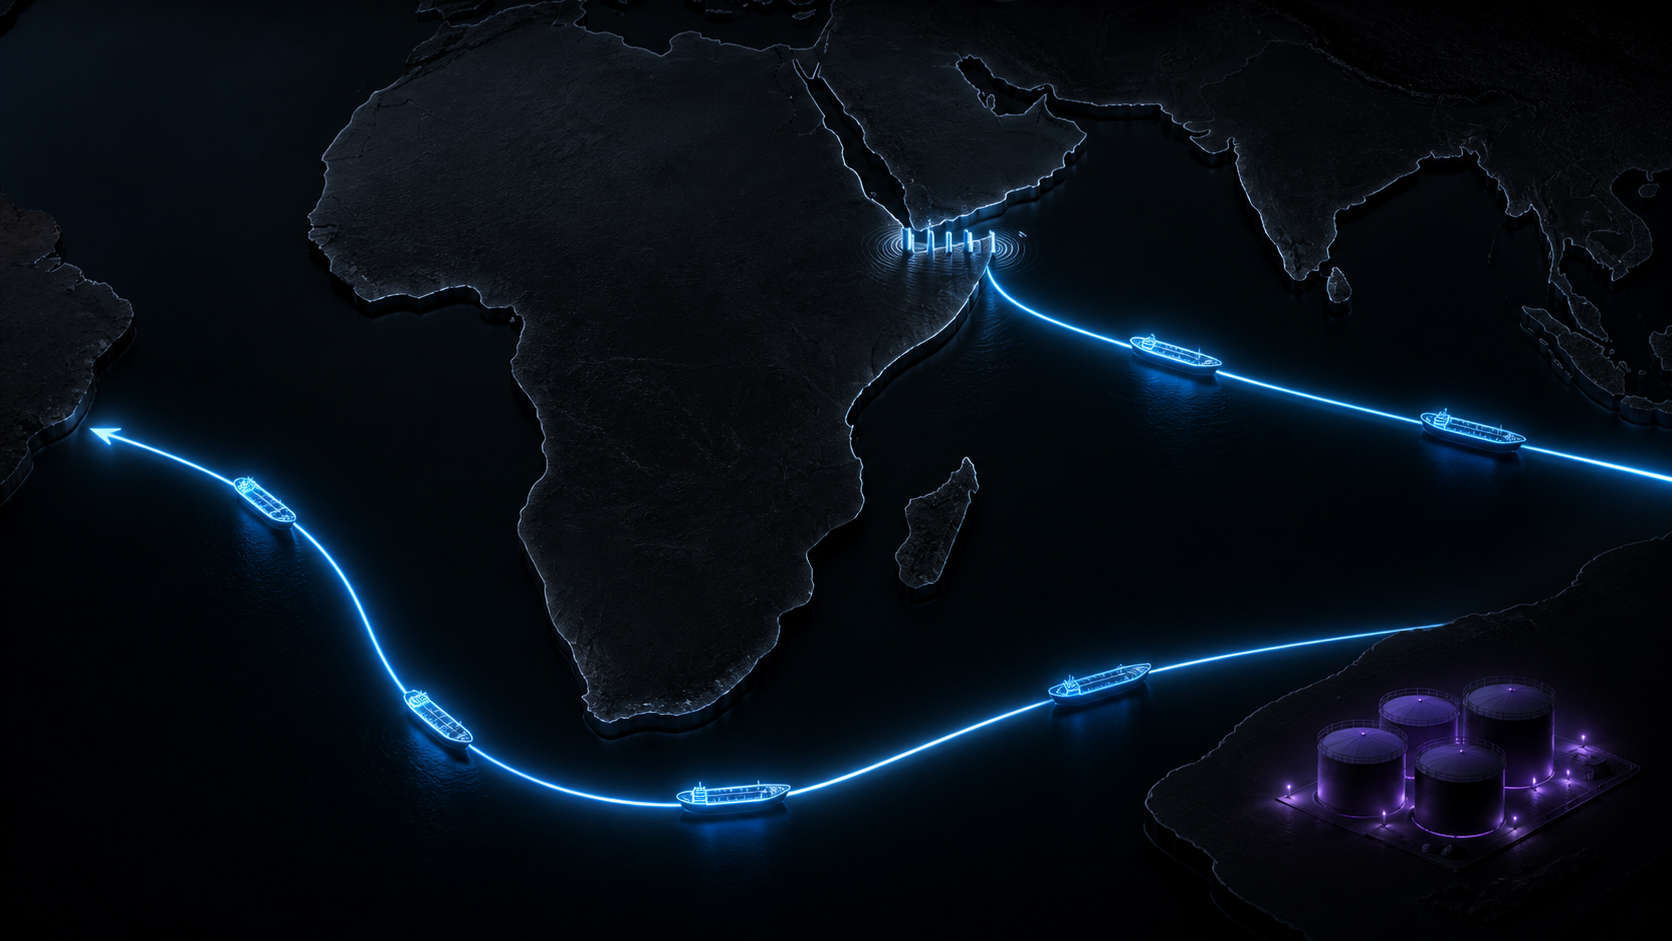
Hormuz is a surface risk. Even with transits down 90%, the Cape of Good Hope reroute physically exists, at a cost in time and money. As established in Part 1, the fleet-wide added cost of that detour runs $40-50 million a week and 10-14 extra days. Painful, but not fatal.
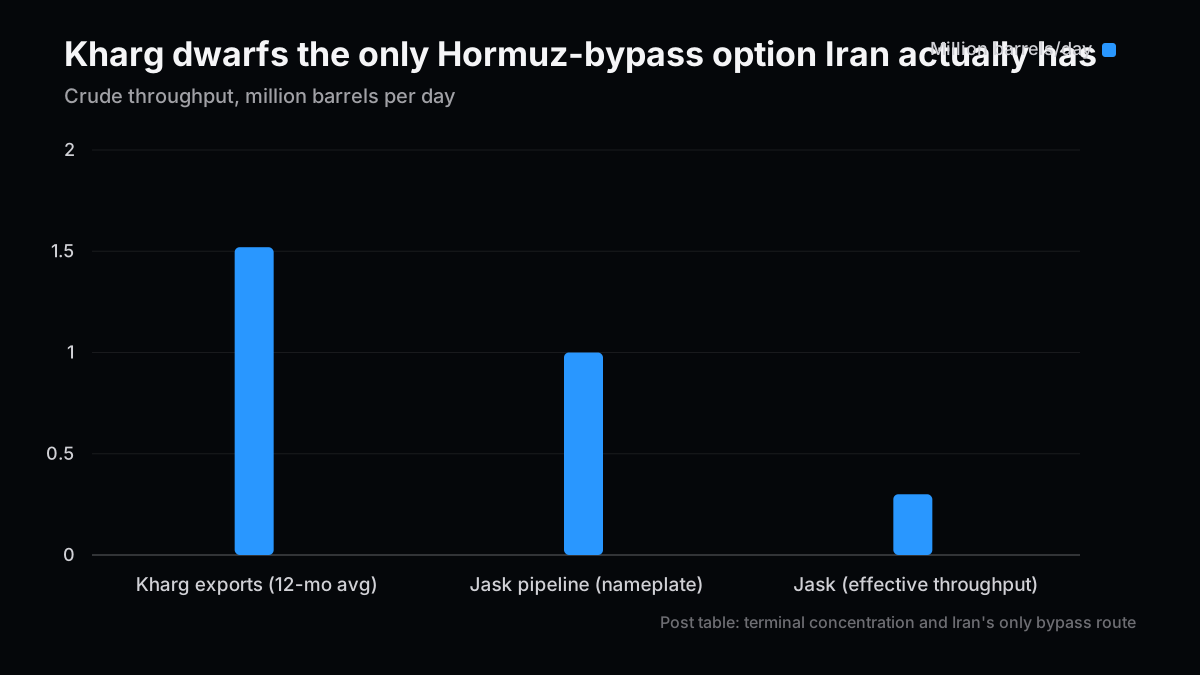
Kharg is a point risk. Kpler's data shows that over the trailing 12 months, 553 of Iran's roughly 587 million barrels of crude exports — a daily average of 1.52 million barrels — moved through Kharg. That is a concentration of roughly 94%. Kharg's total storage capacity runs around 31 million barrels, with inventory at about 58% of capacity as of early March. And Kharg's deep water is unique along Iran's coastline in letting a VLCC load up to 2 million barrels directly in a single lift. The option of "just load somewhere else" barely exists inside Iran.
The one nominal alternative is the Jask terminal on the Gulf of Oman side, and it is strikingly thin. The Goreh-Jask pipeline's design capacity is quoted at 1 million barrels a day, but upstream allocation constraints and limited receiving infrastructure at Jask mean effective throughput runs closer to 300,000 barrels a day. Against Kharg's historical throughput of 1.5-2.0 million barrels a day, Jask can absorb, at best, less than a fifth. Unlike Hormuz, where the alternative is "narrow and slow but real," Jask is closer to "an alternative on paper that barely functions."
A basic caution about reading aggregated data is doing real work here. Any average computed at the country or industry level hides, by construction, whether the underlying load is actually concentrated at a single node — you only see it once you break the aggregate down to the facility level. Outliers that an average completely obscures show up only when you drop one level of granularity. In the same way, the headline "Iran exports roughly 1.6 million barrels a day" tells you nothing about the fact that nearly all of it funnels through one island's one terminal. That habit of distrusting aggregates is exactly why my instinct on seeing the September 5 news was that this is a structurally different kind of risk from anything Hormuz-related.
The buy-side shows the mirror image of this concentration. The bulk of Iranian crude reportedly flows to China, largely to Shandong's independent "teapot" refiners, and Kharg is reported to handle roughly 90% of those shipments. Following the tightened blockade in August, Iranian crude held outside the Persian Gulf and Gulf of Oman fell to around 83 million barrels, down from over 100 million before mid-July. Floating storage near Singapore sits around 40 million barrels. In a sign of buyers pricing in scarcity, Iranian Light crude reportedly flipped from a $3.50 discount to a $3.50 premium against ICE Brent within a single week. I read that as early, concrete evidence that buyers are starting to price the shortage in.
| Metric | Figure | Implication |
|---|---|---|
| Kharg's export share | ~94% of Iranian crude exports (1.52M bbl/day) | No real alternative terminal exists domestically |
| Jask pipeline effective capacity | ~0.3M bbl/day (nameplate 1.0M bbl/day) | Under a fifth of Kharg's historical throughput |
| Crude held outside the Gulf/Gulf of Oman | ~83M barrels (down from over 100M before mid-July) | Supply tightness starting to show up in the data |
| Iranian Light vs. Brent spread | Flipped from -$3.50 to +$3.50 within a week | Buyers pricing in scarcity |
How Insurance, Tankers, and LNG Price This Risk
The investment framework I built in Parts 1 and 2 was calibrated to transit risk through the strait. Overlay Kharg's point risk on top of that, and several of those calls need adjusting.
Start with insurance. Reviewing the Lloyd's Market Association's statement produced a genuine surprise. On Hormuz-linked hull war risk, 88% of Lloyd's marine war market participants report continued appetite to underwrite, and more than 90% say the same for cargo. In other words, "ships aren't moving because insurance isn't available" is the wrong read — the LMA states plainly that the actual constraint is shipmasters and owners independently assessing the safety risk as too high. Since March, only 111 vessels over 10,000 dwt have transited Hormuz (39 bulk carriers, 23 crude tankers, 16 containerships, and others), and JMIC has documented 23 attacks on commercial vessels and infrastructure in the region. What that tells you is that the capital tap for insurance itself has not shut off. If that's true, the market can normalize quickly once the safety assessment shifts, without being capacity-constrained on the insurance side — which is, if anything, a partial reinforcement of the tanker-and-insurance basket thesis from Part 2.
Here's where it gets more complicated, though. The Part 2 tanker basket call (FRO/STNG/DHT/INSW) rested on a strait-type logic: shipping gets jammed, freight rates rise. In a scenario where Kharg's core infrastructure sustains real damage, that logic can invert. If the cargo itself physically disappears, tanker demand should shrink, not grow. In Part 2, I noted that Qatar's Ras Laffan LNG facility carries a hardened 3-5 year repair estimate. If Kharg's core infrastructure took comparable damage, crude would face a tail risk on a similar timeline. This is not simply extending Part 2's conclusion — it is a shift in the underlying premise: a shipping bottleneck and the physical loss of a loading facility trace completely different recovery curves.
So what should carry the most weight right now? Chubb's $400 million war-risk consortium (live since June 19) and Beazley's $1 billion consortium (launched in April) remain, as I wrote in Part 2, small slices of much larger diversified portfolios — but their optionality value in a tail scenario looks higher to me now than it did then. I'd keep the tanker basket call as a read on strait-type risk while explicitly acknowledging it does not hedge damage to Kharg itself. The LNG alternative-supply names, Cheniere and Venture Global, start to carry a dual role: the same multi-year long thesis that applies to Ras Laffan's rebuild timeline now also applies, by the same logic, to a Kharg-damage scenario.
| Sector/Name | Sensitivity to strait-type risk | Sensitivity to terminal-type risk |
|---|---|---|
| Tanker basket (FRO/STNG/DHT/INSW) | High (freight spikes are a tailwind) | Limited to negative (less cargo to carry) |
| Marine war-risk insurers (Chubb/Beazley) | Moderate (premium spikes are a tailwind) | High (tail-scenario optionality) |
| LNG alternative supply (Cheniere/Venture Global) | Low | High (same multi-year long as Ras Laffan) |
Scenarios, and What Would Change My Mind
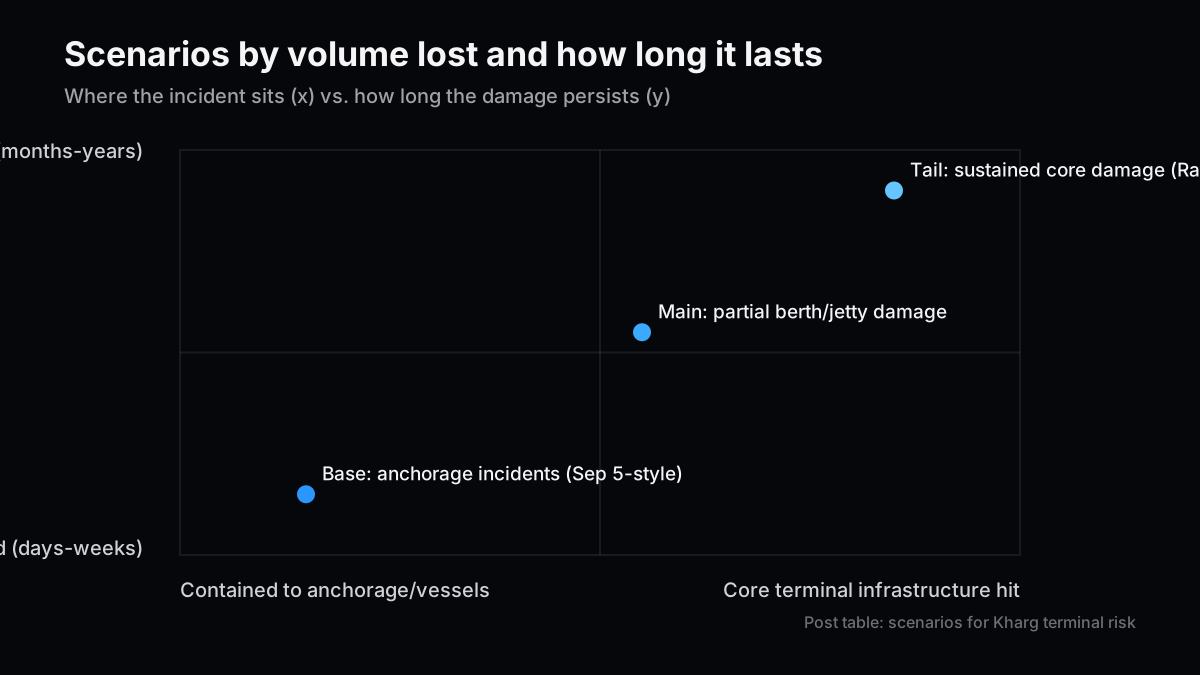
Pulling this together into base, main, and tail cases. The pivot is whether the September 5 episode stays contained to the anchorage or gradually creeps toward the terminal itself.
| Scenario | Description | Brent | Implication for positioning |
|---|---|---|---|
| Base: contained to anchorage | Sep 5-style incidents recur, but core loading infrastructure stays undamaged | $85-95/bbl | Keep the tanker basket call on strait-type logic |
| Main: partial berth damage | Loading berths or pipework take partial damage, capacity dips for weeks to months | $100-120/bbl | Add insurance, get selective on tankers, weight LNG alternatives more |
| Tail: core infrastructure damage | Storage or pumping infrastructure takes core damage, requiring a multi-year rebuild | $130+ | Tanker demand itself contracts; LNG alternative supply becomes a structural long |
My own current stance: neutral on the short term, selectively long on the medium term. I'm keeping the tanker basket as a read on strait-type logic, while running insurance optionality and LNG alternative supply in parallel as a separate hedge against a Kharg-specific tail. As covered in Part 1, the Hormuz transit data and the Brent-BDTI spread were already used to grade the leading-indicator hypothesis I set out before the war began in Idea 1 (Part 1's opening piece). This Kharg-specific risk has not yet accumulated enough of a track record for that kind of grading. I want to be upfront that this part is genuinely still unresolved for me.
Let me state explicitly what would change my mind. If third-party sources — satellite imagery, for instance — confirm direct damage to Kharg's loading berths or storage infrastructure, and daily export volume is verified to have fallen by more than 30% for more than 30 days, that would no longer be a tail scenario — it would be the main scenario actually materializing, and I would shift weight out of the tanker basket and into LNG alternative supply and insurance optionality. Conversely, if Iran's Jask expansion plans firm up and effective throughput approaches something like 1 million barrels a day, the entire premise of "no real alternative exists" would erode, and I would need to revisit this piece's conclusions from the ground up.
Next Issue Ideas
- Idea 1: Grading the Kharg damage claims against primary data — Once satellite imagery or export statistics are verifiable, check which of the base, main, or tail scenarios this piece actually landed on.
- Idea 2: Where China's teapot refiners source around Kharg — As supply from Kharg tightens, how far can independent Chinese refiners shift toward Russian, Iraqi, or UAE crude, tracked through price-spread data.
- Idea 3: Testing whether Jask expansion is real — If Iran announces investment to raise Jask's effective capacity, how much of this piece's "no real alternative" asymmetry actually erodes.
Related Posts
- Oil's New Map, Six Months Into the Iran War — Part 1: How Routes and Stockpiles Actually Shifted — The primary-data verification of Hormuz transit risk that this piece builds beyond, into terminal-level risk.
- Oil's New Map, Six Months Into the Iran War — Part 2: The Investment Playbook in Tankers, War-Risk Insurance, and SPR Refill — The tanker, insurance, and LNG framework this piece re-tests against terminal risk.
- US Stock Market Outlook: Iran-US Tensions — The source of the Brent-BDTI leading-indicator hypothesis referenced in this piece.
References
Facts and figures in this piece prioritize primary and official sources readers can verify themselves.
- Blasts heard near Iran's Kharg Island amid reports tanker hit (Al-Monitor)
- Oil tanker reportedly hit near Iran's Kharg Island after blasts heard (The Week)
- US-Iran Hormuz tanker fire near Kharg (Rio Times Online)
- 2026 Kharg Island attack (Wikipedia)
- Kharg Island: Iran's Oil Backbone & Greatest Vulnerability (Kpler)
- Safety concerns, not insurance availability, driving reduced vessel traffic in the Strait of Hormuz (Lloyd's Market Association)
- Kharg Island targeted in U.S. strikes as Hormuz tensions lift oil prices (World Oil)
This article is for informational purposes only and does not constitute investment advice or a recommendation of any specific stock, service, or contract structure. The author may hold positions or interests related to companies or services mentioned. Generative AI was used for parts of research, translation, and proofreading, with final review by ZYL0. See the disclaimer for details.