Why a Blowout Jobs Print Sinks Stocks: Rereading a 3x Beat Through the Discount Rate
August payrolls came in at roughly three times consensus, hike odds climbed, and all three major indexes closed lower. This piece traces that chain through the discount rate and the duration of AI-capex equities.

August payrolls came in at roughly three times consensus, hike odds climbed, and all three major indexes closed lower. This piece traces that chain through the discount rate and the duration of AI-capex equities.


Why a Blowout Jobs Print Sinks Stocks: Rereading a 3x Beat Through the Discount Rate
I finished writing the two Warsh Shock pieces on the morning of September 4. By that evening, the market handed me a scoring sheet far sooner than I expected: the August employment report. I looked at the headline number and thought, this is going to pull stocks down. It did.
And yet, when I try to explain to someone why it pulls stocks down, I stumble more than I would like. The economy is strong, so stocks fall. That sentence trips up almost every new investor, and if I am honest, it tripped me up once too. So let me take the whole thing apart through a single piece of plumbing: the discount rate.
Three Times Consensus, and the Indexes Still Closed Red
Start with where the print landed.
| Item | Consensus | Actual | Note |
|---|---|---|---|
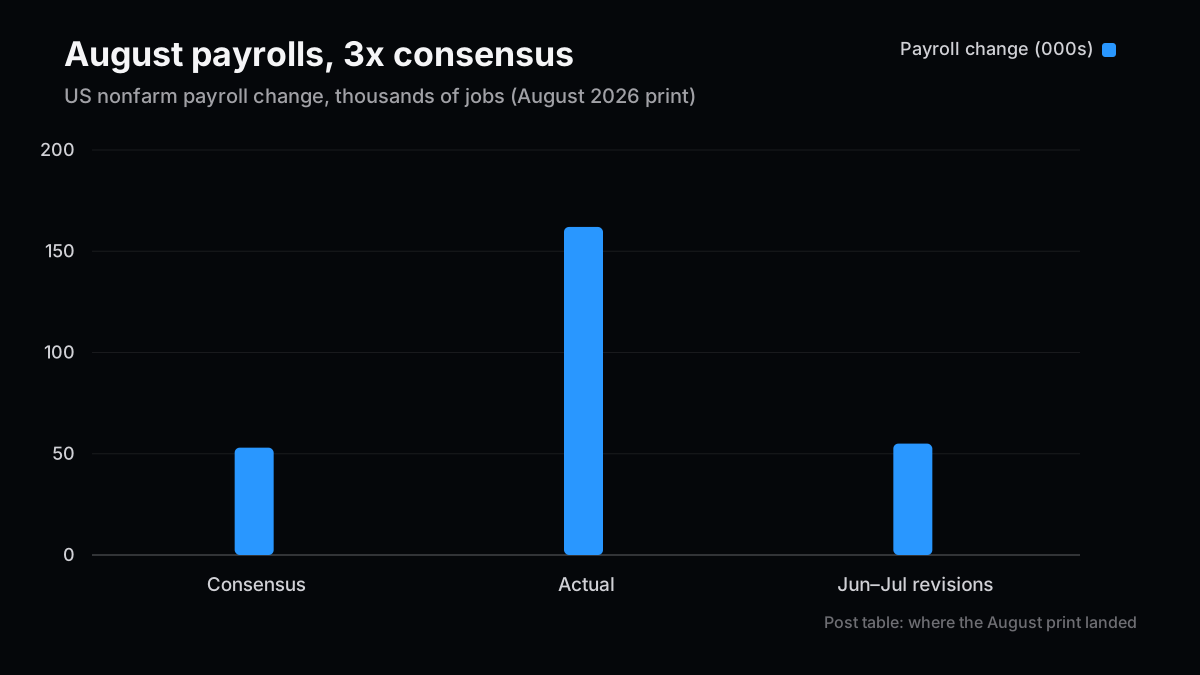
| Nonfarm payrolls | +53,000 | +162,000 | Largest monthly gain since March |
| Unemployment rate | 4.1% | 4.1% | Held steady, as expected |
| June + July revisions | — | +55,000 combined | Erased July's reported job losses |
| Food services & drinking places | — | +59,000 | Main driver of the gain |
| Local government education | — | +42,000 | Second driver |
| Information industry | — | Shed jobs | Consistent with AI-related headcount cuts |
A consensus of +53,000 against an actual of +162,000 is roughly a threefold beat. On top of that, revisions to June and July added a combined +55,000, which rewrote the very fact that July had shown job losses. The narrative of a cooling labor market that had built up over recent months was overturned in a single morning.
What actually caught my eye first was not the headline but the composition. The gain was carried by food services and local government education, while the information industry shed jobs. In other words, employment fell in the sector where AI bites hardest and rose in face-to-face services where it does not. The strength inside this print does not necessarily mean the tech economy is strong. Hold that thought — it matters later.
Then the market responded in the direction that feels wrong.
| Measure | Move on Sept 4 | Level / note |
|---|---|---|
| S&P 500 | -0.38% | Closed at 7,718.60 |
| Nasdaq Composite | -0.29% | Closed at 26,506.99 |
| Dow Jones Industrial Avg | -0.51% | Down more than 260 points |
| US 2-year Treasury yield | Higher | Highest since January 2025 |
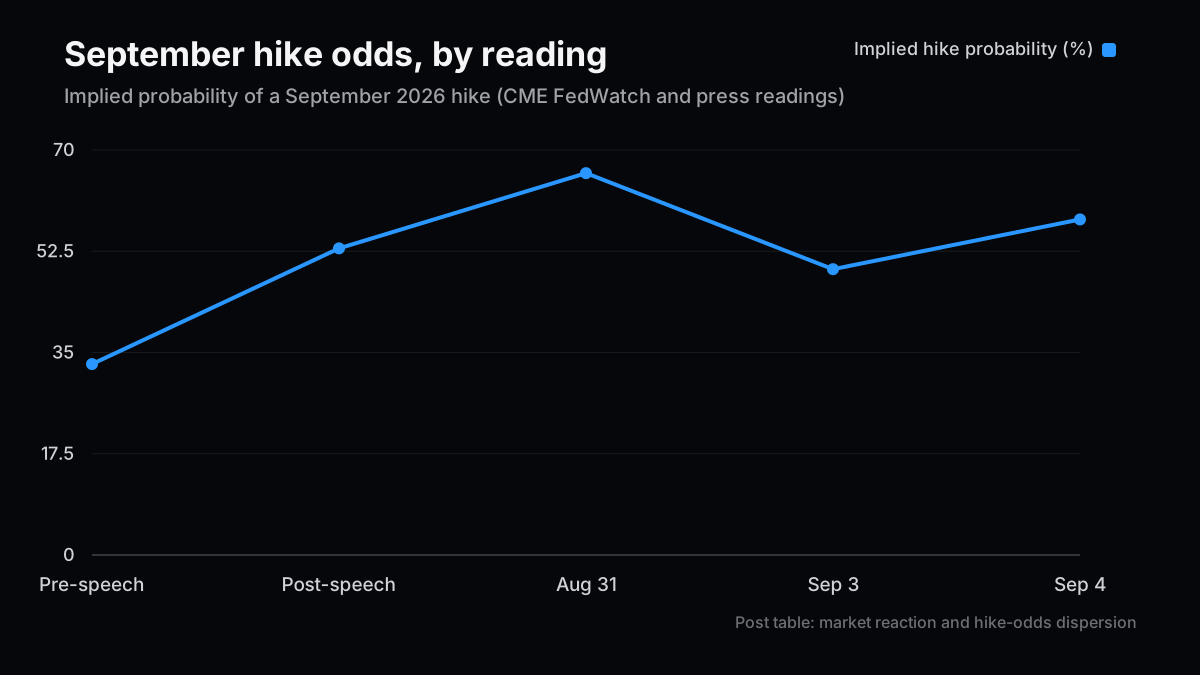
| September hike odds | 49.4% → 58% | CME FedWatch, day over day |
The economy is strong. Jobs were added. And all three major indexes closed lower — with the biggest decline coming not from the tech-heavy Nasdaq but from the Dow. That last detail matters, and I will come back to it.
The Discount Rate Is the Only Pipe
Here is the core of it. "Good news is bad news" is a worn-out market phrase, and memorizing it as a slogan does nothing for you. What matters is knowing which pipe converts the good news into the bad news.
There is only one pipe: the discount rate.
A share price is the sum of future cash flows discounted back to present value. The numerator is future earnings; the denominator is the discount rate. A strong jobs print moves both.
- Numerator: strong economy → better revenue and earnings outlook → positive for prices
- Denominator: strong economy → higher odds of a hike → higher discount rate → negative for prices
What happened on September 4 was simply that the denominator moved more than the numerator. The market judged that the discount-rate effect of hike odds sliding from 49.4% to 58% outweighed the earnings effect of 162,000 additional jobs.
Is that really right? Or, more precisely: the numerator had already been largely priced in. Fed Chair Warsh, in his August 28 Jackson Hole remarks, stressed the strength of real activity, downplayed labor-market risk, and said high inflation should be the Fed's "predominant focus." If the Chair has already declared the economy strong, then an upside surprise in payrolls carries little new information for the numerator — while being decisively confirmatory for hike odds. The information is asymmetric.
That asymmetry is then amplified by the fact that discount-rate sensitivity varies enormously across equities.
| Equity type | Center of gravity of cash flows | Price impact of +1% discount rate | Examples |
|---|---|---|---|
| High-dividend, mature | 1–5 years (near) | Small | Staples, utilities |
| Typical quality compounder | 5–10 years | Moderate | Large-cap consumer |
| High-growth, front-loaded capex | 10–20 years (far) | Large | AI capex, SaaS |
| Pre-monetization theme names | 20+ years | Very large | Some AI-infrastructure names |
This is exactly bond duration logic. The farther out the center of gravity of the cash flows, the more elastic the price is to a change in the discount rate. Translated into equities: a stock bought for the earnings it will have is more rate-sensitive than a stock bought for the earnings it has.
Now back to the detail I parked: the Dow fell the most. On pure duration logic, the Nasdaq should have led the decline. Instead the Dow was down 0.51% against the Nasdaq's 0.29%. So this session was not a clean duration repricing. The cyclicals, financials, and capital-goods names that populate the Dow were also absorbing a separate channel — higher borrowing costs on real balance sheets. The discount-rate story is powerful, but it does not explain the whole tape, and it is worth holding it at that resolution rather than overselling it.
Why AI-Capex Names Sit Most Exposed Right Now
As set out in Part 2, combined 2026 capex across the four hyperscalers runs near $725 billion, up 77% year over year. And the funding structure behind it changed materially over the past year: the ratio of incremental debt financing to capital expenditure rose from roughly 9% in FY24 to about 32% on a 2026 trailing-twelve-month basis.
Lay those two numbers over the discount-rate discussion and you can see that AI-capex equities are exposed to rates twice over.
| Channel | Mechanism | Where it shows up |
|---|---|---|
| Discount rate (denominator) | Investment premised on distant payback → long duration | Valuation multiple |
| Funding (real cash) | About a third of capex funded by external debt → rates hit expense | P&L and free cash flow |
| Demand (numerator) | Customers' own capex appetite cools as rates rise | Orders and revenue |
An ordinary growth stock is exposed to the first channel only. Companies at the core of the AI buildout take the first and second simultaneously. When I wrote in Part 2 that the move from 9% to 32% was fast, what that speed actually means is this: compared with a year ago, there is now more than three times as much room for higher rates to walk straight into the income statement rather than stopping at the multiple.
From having taken an internal proposal from proof-of-concept through a capital approval in the hundreds of millions of yen and out the other side into execution, I can say that when an internal hurdle rate moves by a couple of points, projects with identical economics stop clearing the committee in the same way. Nobody ever says "we are stopping this because rates went up." What happens instead is that the review period stretches, extra sensitivity analysis gets requested, the program is split into phases — and a year later you notice the whole thing has slipped. Capex deceleration shows up as delay, not as an announcement. That is the single easiest thing to miss when reading the numbers.
There is a second timing problem. From the years I spent running TCAD process simulations in automotive EEPROM development, the lag between a demand signal and an actual production plan is measured in quarters — wafer starts to lot completion alone eats several. Even if the hyperscalers throttle orders, it does not reach NVIDIA's or the memory makers' reported numbers until the following quarter at the earliest. Which cuts the other way too: the fact that earnings look good right now is not evidence that higher rates are failing to bite. Equity prices front-run that lag. The Nasdaq's decline on September 4 was precisely that front-running.
How I Would Carry Positions Into the September FOMC
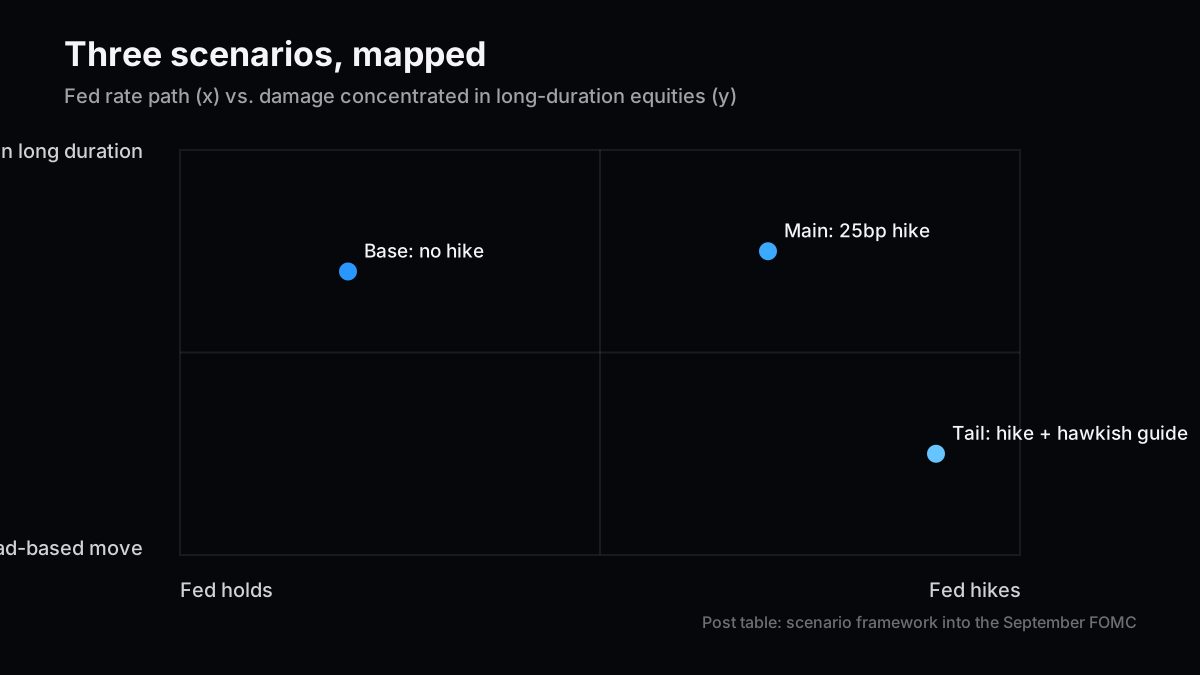
In Part 2 I put the most weight on the "main case: partial deferral" scenario heading into the September FOMC. How does the jobs print change that? Briefly: I shift the probability mass slightly toward the main case, but I do not change the skeleton.
| Scenario | Content | Discount-rate implication | Implication for AI-capex names |
|---|---|---|---|
| Base: no hike | CPI undershoots, FOMC holds with a dovish tone | Long yields fall | Sharp rebound as the duration unwind reverses |
| Main: 25bp hike | One hike as priced, then wait and see | Front end up, long end limited | Selection intensifies; self-funded names win |
| Tail: hike plus hawkish guide | Hike accompanied by signals of further tightening | Whole curve shifts up | Funding channel hits directly; broad decline |
What nags at me behind these numbers is that the hike probabilities themselves do not agree across sources. CME FedWatch puts it at 49.4% on September 3 and 58% on September 4; press coverage has cited 52% to 59% for the same move; an August 31 reading came in at 66%. That is a spread of more than ten points. I read that dispersion not as measurement noise but as evidence that the market itself is not yet convinced. When the probability is loitering around 55%, betting on direction is a poor use of risk.
So my current stance is neutral on the short term, selectively long on the medium term. Concretely: stop holding the AI-capex theme as a single block, and split it along the free-cash-flow self-sufficiency axis laid out in Part 2. Companies that can fund their buildout from operating cash flow and companies leaning on external financing will show visibly different resilience to the rate path over the coming months. The phase where you buy the theme is over. This is the phase where you pick on the balance sheet.
Let me also state what would change my mind. If next week's US CPI comes in clearly below expectations and September hike odds fall back under 40%, the discount-rate story is temporarily voided. In that case I would raise the weight on the base scenario and turn into a buyer of longer-duration names rather than a seller. Warsh himself conceded in his remarks that recent PCE and CPI prints came in better than expected, while adding that they do not signal that underlying trends have meaningfully improved. Read the other way: one data point that does show improvement in the trend weakens the Chair's own argument. CPI is the shortest route to that data point.
The jobs report looked like a story about the numerator. It was a story about the denominator. The September FOMC and next week's CPI will score the scenarios from all three of these pieces at once.
Next Issue Ideas
- Idea 1: Scoring all three pieces after the FOMC — Grade the rate, dollar-yen, and capex scenarios from Parts 1, 2, and this piece against the actual FOMC outcome and market reaction.
- Idea 2: Re-ranking AI-capex names by FCF self-sufficiency — Turn "pick on the balance sheet, not the theme" into an actual single-name ranking built from reported financials.
- Idea 3: The one sector that shed jobs — Start from the information industry's decline in this print and test when AI-driven headcount substitution actually reaches the income statement.
Related Posts
- The Warsh Shock — Part 2: How Far Rate Risk Reaches Into Tech Capex — The hypothesis this piece tests against real data.
- The Warsh Shock — Part 1: How Jackson Hole Rewired the Rate and Dollar-Yen Outlook — The Jackson Hole speech that set the discount rate moving.
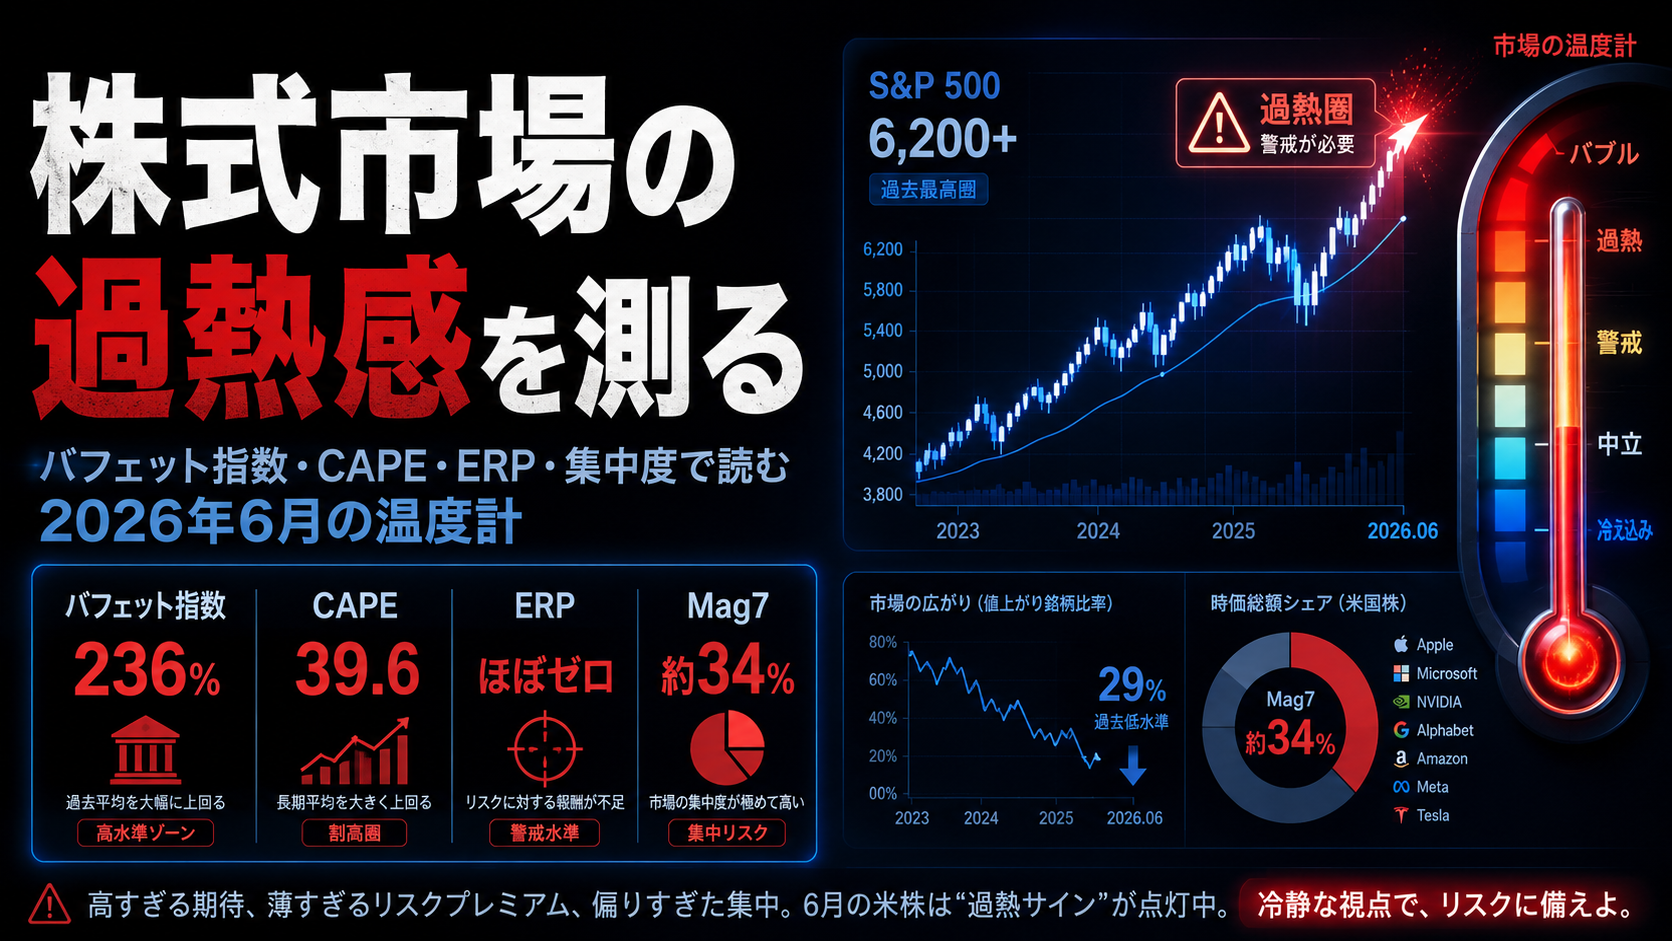
- Measuring Market Overheating: Buffett Indicator, CAPE, ERP and Concentration in June 2026 — Useful for gauging how much valuation cushion exists to absorb a higher discount rate.
References
Facts and figures in this piece prioritize primary and official sources readers can verify themselves.
- Employment Situation Summary — 2026 M08 Results (U.S. Bureau of Labor Statistics)
- Jobs report August 2026 (CNBC)
- Stock Market Today, Sept. 4, 2026: Yields jump, stocks fall after jobs report surprises to upside (TheStreet)
- Markets see Warsh endorsing a rate hike in September. Not everyone is convinced (CNBC)
- Fed's Kevin Warsh warns inflation is too high, sparking bets rate hikes are coming (NPR)
This article is provided for informational purposes only and is not a recommendation or investment advice regarding any specific security, service, or contract terms. The author may hold positions or have interests in the names discussed. Generative AI was used for parts of the research, translation, and proofreading, but the final content has been reviewed by ZYL0. Please see the disclaimer for details.