800V AI Data Centers: Comparing GaN and SiC Through Power Losses
Where do GaN and SiC fit in 800V AI data centers? Compare current, calculate the value of one efficiency point, and distinguish technical roadmaps from qualified production.
Where do GaN and SiC fit in 800V AI data centers? Compare current, calculate the value of one efficiency point, and distinguish technical roadmaps from qualified production.


When reading about 800V data centers, my first question is where losses leave the power path and where new components enter it. Ranking GaN against SiC before identifying those locations can obscure the different jobs of distribution, voltage conversion, and fault interruption.
The direct answer is that 800V describes a power distribution rail, not the operating voltage of a GPU. Designs can use SiC for high-voltage conversion or protection and GaN for dense conversion further down the path. Those roles are not fixed by a material name. Voltage stress, circuit topology, load, temperature, cost, and qualification determine whether a particular device belongs in a particular position.
This article narrows the AI electricity bottleneck map to the facility-to-rack power path. It uses primary material checked through September 12, 2026, together with explicitly labeled calculations. The calculations are illustrative engineering and financial comparisons, not measured product performance, installation quotes, or forecasts of market demand.
What changes when distribution moves to 800V?
I start by removing vendor labels and checking the order of magnitude of the current.
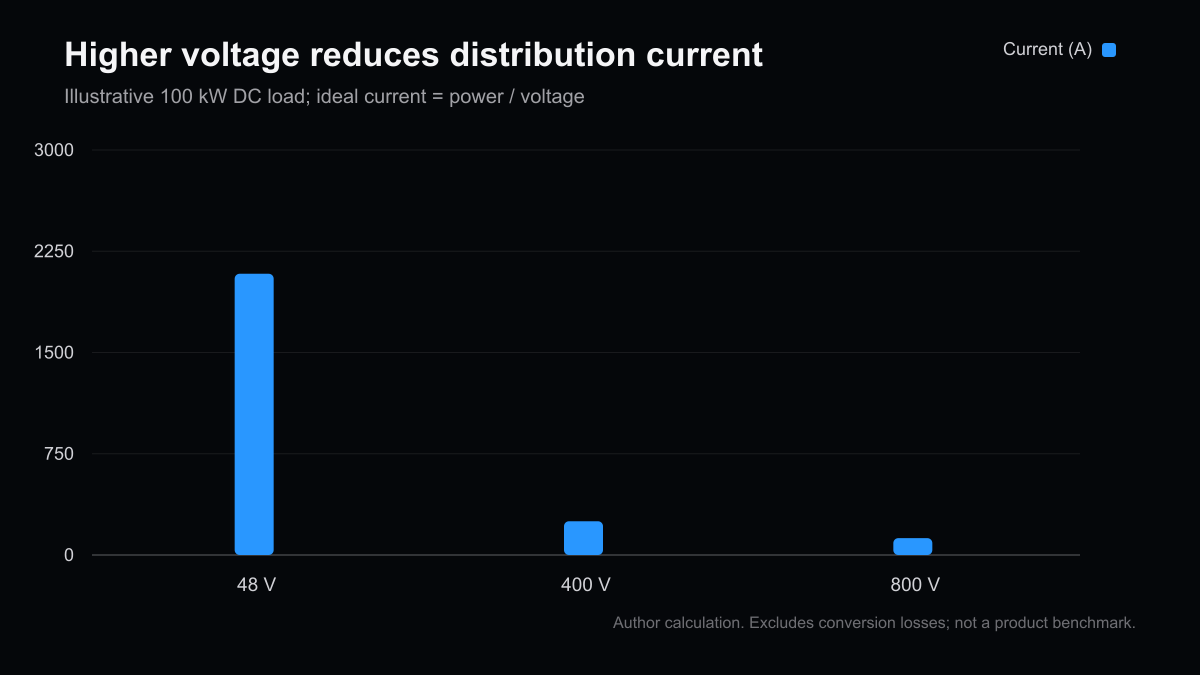
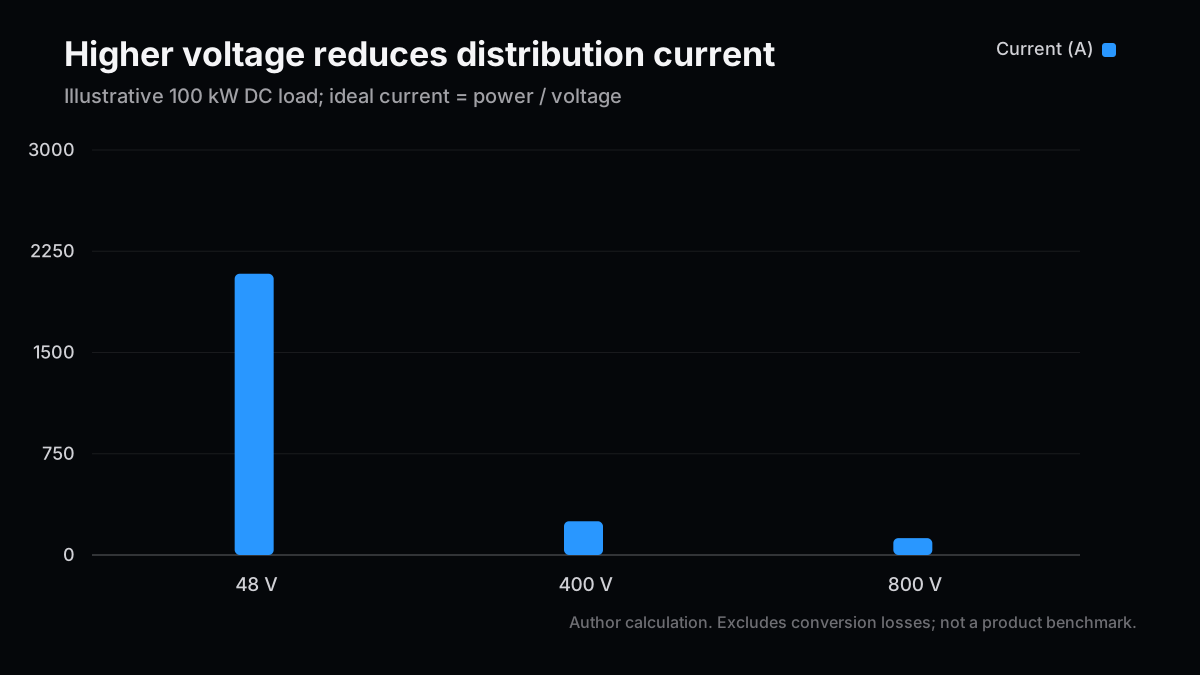
For an ideal DC path, current equals power divided by voltage. Delivering 100kW at 48V requires about 2,083A; delivering the same power at 800V requires 125A. These figures exclude conversion losses and do not describe the specification of a particular server or power supply.
| Distribution voltage | Current at 100kW | Current at 1MW | Current relative to 48V |
|---|---|---|---|
| 48V DC | 2,083.3A | 20,833.3A | 100% |
| 400V DC | 250.0A | 2,500.0A | 12% |
| 800V DC | 125.0A | 1,250.0A | 6% |
The 48V baseline makes the comparison easy to inspect. It does not imply that every existing rack uses exactly 48V. TI's technical discussion separates the move to higher-voltage distribution from the lower-voltage power stages that remain downstream. An assessment of an actual facility should substitute its actual bus voltage and define which part of the path is under discussion.
A conductor-loss reduction is not a facility-wide saving
With resistance held constant, resistive heating scales with the square of current. The current ratio between the 800V and 48V cases is 0.06, so the ratio of conductor losses is 0.0036. That corresponds to a 99.64% reduction in this isolated loss term under the stated assumptions. It does not mean that the data center consumes 99.64% less electricity.
Real designers can trade some of the lower current for thinner conductors, which increases resistance. Connectors, protection devices, and converters also contribute losses. The power used by the compute load does not disappear from the budget. Keeping conductor size unchanged, reducing copper while holding loss approximately constant, and splitting the benefit between the two are different design choices. Comparing them requires a baseline circuit and a consistent measurement boundary.
Higher voltage also changes the electrical stress placed on insulation and connected equipment. A component selected for the lower-voltage rail cannot simply be moved to the higher-voltage side. A lower material requirement in the distribution path may coexist with a higher price for other components. The complete bill of materials, installation work, and operating conditions decide whether the resulting design is economical.
This is why a compelling current ratio is useful but insufficient. It tells us why an architecture deserves investigation. It does not settle the design, prove a specific efficiency claim, or quantify the cash benefit to an operator. I would keep that arithmetic near the beginning of any comparison, then insist on a separate reconciliation to measured system losses.
Where do GaN and SiC fit in the power path?
My comparison unit is the job performed by a conversion stage, rather than the semiconductor material in isolation.
Infineon's intermediate bus converter material describes high-voltage inputs around 800V and conversion to intermediate rails such as 50V, 12V, and 6V. It is a concrete illustration of why adopting 800V distribution does not put every component in the rack on an 800V rail. The voltages below organize functions; they are neither a recommended circuit nor a guarantee of component suitability.
| Function being compared | Illustrative voltage boundary | First conditions to verify | What the material label does not establish |
|---|---|---|---|
| Facility-side high-voltage conversion | Facility supply to 800V DC | Isolation, efficiency curve, upstream integration | Topology and complete cost of a design using SiC |
| Intermediate bus conversion | 800V to an intermediate rail such as 50V | Conversion ratio, frequency, magnetics, cooling | Placement of GaN, SiC, and silicon across stages |
| Lower-voltage delivery | A rail around 48V to lower voltages | High current, transients, packaging density | Losses in interconnects, control, and packaging |
| Fault interruption | An 800V DC distribution path | Interruption time, normal-operation loss, coordination | Combined performance during normal and fault conditions |
Infineon's Japanese release dated September 10, 2026 describes expanded work with SolarEdge on a solid-state circuit breaker using SiC JFET technology. This is one example of component demand that an efficiency-only discussion can miss. The announcement establishes a development collaboration, not a disclosed volume of qualified shipments or a quantified revenue contribution.
Conditions behind a high-frequency advantage
Higher switching frequency can create room to reduce some surrounding components, but it also changes switching losses, drive requirements, noise, and thermal behavior. A device being suited to high-frequency operation and a finished system offering better efficiency, price, and reliability are separate propositions. My preference is to compare performance across the expected load curve before relying on the highest advertised efficiency.
Suppose one supplier reports the best point at rated load while another presents an average over loads from 20% to 100%. Putting those two percentages beside each other does not create a valid comparison. Input voltage, output voltage, delivered power, cooling, and treatment of auxiliary consumption need to match. Identical headline efficiencies can describe different measurement boundaries.
The same discipline applies to density. A smaller converter may require supporting cooling or filtering equipment outside the photographed assembly. A fair comparison includes the equipment that must actually be installed. Otherwise, moving a component outside the measurement boundary can look like a technical improvement even when the installed system is unchanged.
Protection belongs in the economic model
A protection device that remains in the current path contributes losses in ordinary operation. Removing one conversion stage can produce an efficiency gain that is partly consumed elsewhere. Conversely, containing a fault can have operational value by limiting interruption and recovery. That value belongs in a separate line from energy savings, with its own evidence and assumptions.
An avoided-downtime calculation should not silently assume that every rack loses its maximum revenue simultaneously. Redundancy, workload movement, recovery time, and contractual obligations all affect the result. If failure data are unavailable, the failure rate should remain an unknown or an explicit scenario variable. Treating it as zero, or substituting an unsupported industry average, creates unjustified precision.
This is an area where uncertainty can be more important than the third decimal place of efficiency. A device with attractive steady-state measurements may still need qualification under fault conditions. A technically complete solution may also need to fit the operator's maintenance practices. These are questions to ask of the evidence, not conclusions about any supplier named here.
What is one efficiency point worth in electricity costs?
The decision framework I find most useful converts an efficiency improvement into annual cash savings before comparing it with the additional installed cost.
Assume a conversion path that continuously supplies a fixed 1MW output. Input power equals output power divided by efficiency. For the first calculation, assume 8,760 hours per year and an energy price of US$0.10/kWh. Exclude taxes, demand charges, cooling interactions, failures, and installation work. Efficiency is held constant for simplicity; an actual design review needs measurements at different loads.
| Conversion efficiency | Required input power | Loss within the path | Input reduction when improved to 98% |
|---|---|---|---|
| 96% | 1,041.67kW | 41.67kW | 21.26kW |
| 97% | 1,030.93kW | 30.93kW | 10.52kW |
| 98% | 1,020.41kW | 20.41kW | 0kW |
Moving from 97% to 98% improves efficiency by one percentage point and reduces required input by approximately 10.52kW. Under continuous operation, that is approximately 92.15MWh each year, worth about US$9,215 at the assumed tariff. The calculation uses a fixed output boundary. Simply taking 1% of 1MW gives a useful approximation, but leaves the treatment of input and output less explicit.
It is also necessary to distinguish a percentage-point improvement from a percentage reduction in losses. In this example, path losses fall from approximately 30.93kW to 20.41kW. That is a substantial fraction of the original loss, while the reduction in total input remains much smaller. Both statements can be true. Only the input reduction, multiplied by operating time and tariff, belongs in this electricity-cost calculation.
Utilization changes the payback
For a second simplified comparison, define effective utilization as the fraction of the year during which the specified output is supplied. This is not CPU utilization or the utilization of an AI model. The linear approximation assumes the same efficiency whenever operating and leaves standby consumption outside the model.
| Assumed effective utilization | Annual energy reduction | Annual energy-cost saving | Simple payback on US$30,000 incremental cost |
|---|---|---|---|
| 40% | Approximately 36.86MWh | Approximately US$3,686 | Approximately 8.1 years |
| 60% | Approximately 55.29MWh | Approximately US$5,529 | Approximately 5.4 years |
| 100% | Approximately 92.15MWh | Approximately US$9,215 | Approximately 3.3 years |
The US$30,000 incremental cost is an illustrative assumption, not a quote for a product. Higher installation costs, lower energy prices, and lower utilization can all lengthen an energy-only payback. Space savings or changes in maintenance may add value, but they should not be assigned a cash amount without an actual estimate or operating evidence.
A useful sensitivity check is to vary one uncertain quantity at a time. Halving the energy price halves the modeled electricity saving. Doubling the incremental installed cost doubles simple payback. These linear relationships make it possible to identify which missing estimate matters most before refining every other input. They also reveal when a persuasive engineering story depends on an unusually favorable financial assumption.
Discounted analysis would convert each future year's savings into present value before comparing the total with the upfront cost. A saving received five years from now is not interchangeable with cash spent today. I have not inserted an interest-rate forecast here; the table deliberately shows simple payback. For an actual project, useful life and replacement requirements should be checked before selecting a discount rate or building a detailed model.
For multiple conversion stages, efficiencies multiply. Three stages operating at 98% each produce a combined efficiency of approximately 94.12%. Yet eliminating one stage can change the conversion ratio, isolation requirements, and operating point of the stages that remain. Counting stages or multiplying their individually best efficiencies cannot prove finished-system performance. The arithmetic is a starting point; a common measurement boundary is the final test.
Another practical check is to reconcile annual energy with the operating schedule. An installation that ramps gradually should not be modeled as fully utilized from its first day. If compute capacity arrives later than power equipment, the initial years may carry the capital cost without the assumed savings. That timing issue can matter even when the long-run technical performance eventually meets expectations.
Check the distance between a roadmap and revenue
My investment caution comes from the number of evidence steps between joining an ecosystem and earning revenue from it.
NVIDIA's August 2026 explanation distinguishes hybrid deployment in existing facilities from future facility-scale DC conversion. Its expected introduction dates should not be read as shipment records at the date of this article. OCP's public material describes common specifications and work on safety alignment; it does not mean every participating product has completed every relevant qualification.
The IEA's updated 2026 outlook projects data center electricity consumption rising from 485TWh in 2025 to 950TWh in 2030. That is a demand backdrop, not a direct revenue model for a semiconductor material. Architecture choices, adoption timing, customer mix, market share, and pricing sit between aggregate electricity consumption and a company's sales.
| Evidence stage | What to read | What cannot yet be concluded |
|---|---|---|
| 1: Technical announcement | Data sheets, circuit diagrams, measurement conditions | Customers will purchase large volumes |
| 2: Evaluation and qualification | Evaluation results, certification scope, operating conditions | The product can replace alternatives in every facility |
| 3: Production adoption | Disclosed customer adoption, supply arrangements, shipments | Company-wide margins must improve |
| 4: Financial contribution | Revenue mix, gross margin, inventory, capacity burden | The prevailing stock valuation is justified |
This is an order for reading evidence, not a score already assigned to any company. For businesses with broad portfolios, growth in AI-related components can coexist with weakness in other applications. A more concentrated business can be more exposed to a delayed adoption cycle. Neither conclusion about a particular issuer should be treated as established without reviewing its current disclosures.
Even a disclosed customer relationship needs interpretation. Qualification can cover a limited product or operating configuration. A design win may precede volume shipments. Revenue can arrive while qualification spending, production ramp costs, or working capital weigh on cash flow. These are ordinary reconciliation questions that prevent a technology announcement from being treated as a complete earnings forecast.
I would also resist assigning every participating supplier the full value of a single installation. Multiple firms can occupy different points in the same supply chain, and their revenues may overlap economically. Summing component, subsystem, and installed-system markets without adjusting those boundaries can overstate the opportunity. The same care used for power-loss boundaries belongs in the market model.
Keep technology and valuation judgments separate
My near-term stance on the theme is to prioritize evidence of actual adoption. Over the medium term, I would follow conversion and protection together. That is not a decision to choose one material as the universal winner. This article does not evaluate current share prices, earnings forecasts, or balance sheets and therefore does not establish that any named stock is cheap, expensive, or appropriate to buy.
For the next reporting cycle, I would put production timing, evaluation-to-order conversion, capacity, and inventory in one tracking sheet. If growing orders are accompanied by growing inventory, the explanation matters. The purpose is to reduce the number of unsupported assumptions between a technically necessary component and an attractive return to shareholders.
That tracking sheet should retain the original date and wording of each disclosed milestone. Replacing an old expected launch date with a new one can hide a delay. Conversely, comparing a development target with a later qualified product without preserving their different scopes can make progress look larger than the evidence supports. A simple timeline is often more informative than a more elaborate market-size estimate.
What to monitor through 2027
My central working hypothesis is that existing and newly built facilities will move at different speeds. This is a framework to update from subsequent evidence, not a probability-weighted forecast.
| Scenario | Assumption | Observable change to track | Evidence that would change the view |
|---|---|---|---|
| Base case | Gradual adoption of 800V | Evaluation hardware progresses to limited shipments | Repeated postponement of disclosed milestones |
| Main scenario | Existing facilities remain mixed while new sites adopt more DC distribution | Adoption of conversion, protection, and service as a package | Migration costs exceed customer benefits |
| Tail risk | Demand delays or suitability problems | Capex plans or qualification schedules slip | Unclear resolution alongside accumulating inventory |
Increasing rack distribution voltage does not itself create generating capacity or secure a grid connection. Its role is to provide another way to deliver available power with a different conductor burden and conversion path. Keeping that role specific makes it easier to identify which part of an infrastructure investment is actually being evaluated.
The three questions for the next update are concrete. Have disclosed production plans turned into shipments? Are efficiency figures accompanied by a measurement boundary and a load condition? Is installed cost available, including protection and service requirements? When those points are supported, the discussion can move from general material preferences to the value of adopting a particular design in a particular facility.
Until then, the most useful conclusion is conditional. Higher-voltage distribution changes the current problem in a measurable way. Whether the total system is better, and whether the economics support adoption, requires evidence from the rest of the path. That separation is also what makes the analysis reusable when the next device, topology, or roadmap arrives.
Related Posts
- The AI power bottleneck and the power-semiconductor investment map — Separate the roles of the grid, facility, and chip-level supply.
- Investment segments around the data center — Compare power with cooling and optical connectivity within the same infrastructure budget.
- Closing the distance between memory and accelerators — Explore signal and packaging constraints alongside the separate power-delivery problem.
Next Issue Ideas
- Idea 1: Compare 800V protection circuits — Separate normal-operation losses from fault behavior and identify the evidence needed before volume adoption.
- Idea 2: Calculate payback from efficiency and utilization — Test how load curves and electricity tariffs change the economics of the same capital investment.
- Idea 3: Track 800V through power-supplier earnings — Identify which disclosures in the next quarter can establish progress from collaboration to shipments.
References
- NVIDIA: Power architecture migration stages, August 11, 2026
- TI: Addressing data center power delivery with 800V DC, revised May 2026
- Infineon: Intermediate bus converter architecture
- Infineon: SolarEdge collaboration on 800V DC protection, September 10, 2026
- Open Compute Project: Common specifications and migration, August 11, 2026
- IEA: Key Questions on Energy and AI, executive summary
This article provides information, not investment advice. The author may hold securities in the companies discussed. Generative AI was used for research, writing, and translation. Calculations rely on the stated assumptions and do not guarantee product performance or investment returns. See the disclaimer.