Iran War Sparks a Reversal in Coal Stocks
With LNG supply choked by a potential Strait of Hormuz blockade, Asia-wide coal demand is surging and Newcastle benchmarks are hitting 52-week highs. Short and mid-term scenarios for coal equities, read through freight, storage, and contracts.
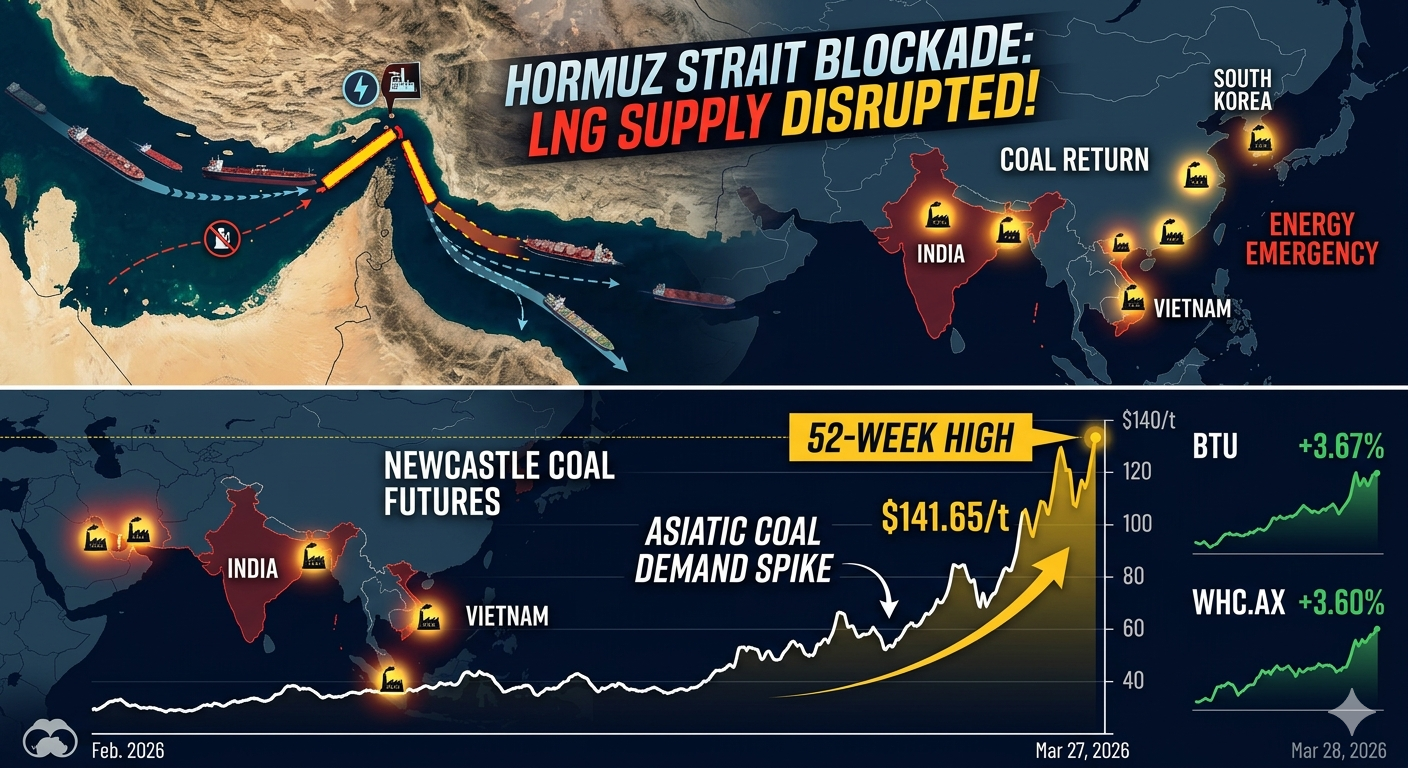
With LNG supply choked by a potential Strait of Hormuz blockade, Asia-wide coal demand is surging and Newcastle benchmarks are hitting 52-week highs. Short and mid-term scenarios for coal equities, read through freight, storage, and contracts.


Coal Stocks' "Reverse Rotation" Triggered by the Iran War
I follow energy investment themes inside a corporate VC. LNG charter rates, European gas storage, and Asian coal prices sit side by side on my screen — and the week of late March 2026 is the first time in years that all three moved together at this magnitude. So in this piece I want to read the coal-stock "reverse rotation" not by the headlines, but by freight, storage, and contracts.
The Energy Fault Line Created by the Hormuz Blockade
Let me first put the underlying facts down flat.
On February 28, 2026, US-Israeli coalition forces launched "Operation Epic Fury," a large-scale strike on Iran. Multiple senior regime figures, including Supreme Leader Khamenei, were killed, and Iran retaliated by effectively blockading the Strait of Hormuz. Since March 2, commercial shipping has been largely halted; ~2,000 vessels and 20,000 crew are stranded.
The strait is a global energy chokepoint that handles roughly 20% of world oil shipments (17.8 mb/d) and ~20% of global LNG (Qatar + UAE). IEA Executive Director Birol called it "the greatest energy security crisis in history" — and judging by the published transit data, that's not rhetoric.
Crude and gas, in numbers
| Indicator | Pre-war (2/27) | Recent (3/28) | Change |
|---|---|---|---|
| Brent crude | $73/bbl | $112.57/bbl | +54% |
| WTI crude | $68/bbl | $99.64/bbl | +47% |
| Newcastle coal | $116/t | $141.65/t | +22% |
| Dutch TTF gas | ~€32/MWh | >€60/MWh | +88% |
| S&P 500 | near highs | ▲7% from high | correction |
Brent rallied from ~$73 on Feb 27 to $112.57 on Mar 28 — the highest since July 2022 (+51%+). Goldman estimates a $14–$18 geopolitical risk premium is in the price. On March 2, Qatar's defense ministry confirmed Iranian drone strikes on Qatari gas facilities; QatarEnergy halted all gas production. Dutch TTF surged past €60/MWh. European gas storage at end-February stood at 46 bcm — well below 60 bcm in 2025 and 77 bcm in 2024.
The "similar but different" structure vs. the 2022 shock
This is the framing I'd most want to highlight. The shape rhymes with 2022's Russia-Ukraine LNG crisis, but the structure is materially different.
In 2022, ~5% of Russian energy exports were affected. The Hormuz closure hits a much larger share of global energy flows directly. On top of that, physical damage to Qatar's Ras Laffan facility is estimated to need 3–5 years of repair, and an estimated 12.8 mtpa of LNG supply is offline. Even after a ceasefire, LNG supply doesn't simply come back — that's the structural twist.
In CVC terms, this isn't a "price shock" so much as a cascade of contractual force majeures. Long-term supply contracts are being renegotiated.
The Coal Return Wave Sweeping Asia
The hole left by missing LNG can only be filled by nuclear, renewables, or coal. Nuclear takes too long to spin up. Renewables can't get grid integration done fast enough. So coal is the instantaneous lever — and that's exactly what's happening across Asia right now.
Korea: the foundation of the energy model is shaking
Korea imports 94% of its energy. ~70% of crude and ~20% of LNG transit the Middle East. Around 15% of LNG imports come from Qatar; after the Ras Laffan strike, Qatar declared force majeure on parts of its long-term gas contracts. The Democratic Party's Middle East Crisis Task Force responded by fully removing the 80% utilization cap on coal-fired generation and pulling forward reactor maintenance to push nuclear utilization to 80%.
Korea's power mix is roughly 33% coal, 31% nuclear, 25% LNG. The moment LNG needs to be replaced, coal and nuclear are the only structural levers.
India: heat plus exploding demand
India is the world's #2 coal consumer and producer. Summer peak power demand is projected to hit 270 GW — nearly double Spain's total generation capacity. The government is accelerating coal output and holds ~3 months of inventory.
Indonesia and Southeast Asia: export controls and pass-through
Indonesia, the world's largest coal exporter, has set its 2026 production target at ~600 Mt (down sharply from ~800 Mt the prior year) and tightened export limits. The Philippines declared a state of national emergency citing the energy supply crisis. Vietnam, hit by unstable Indonesian supply, has begun looking at imports from the US and Laos.
| Country | Response | Coal share | Notes |
|---|---|---|---|
| Korea | 80% cap removed; nuclear → 80% | 33% of power | Supplementary budget on the way |
| India | Coal production accelerated | >70% of power | Summer 270 GW peak |
| Indonesia | Domestic priority; export limits | World's largest exporter | Output cut from 800 → 600 Mt |
| Philippines | National emergency | ~50% | LNG dependency had been rising fast |
| Vietnam | Eyeing US/Laos imports | ~30% | Indonesian supply destabilizing |
Newcastle's price trajectory
| Date | Newcastle ($/t) | Catalyst |
|---|---|---|
| Late Jan 2026 | ~$111 | China's plan for 100 additional coal plants |
| Early Feb | ~$115 | Indonesia output cut headlines |
| Feb 24 (pre-war) | ~$116 | US-Iran diplomacy collapsing |
| Mar 3 (war start) | ~$125 | Hormuz blockade |
| Mar 6 | $132 | Qatar LNG facility hit |
| Mar 17 | $135 | Korea removes coal cap |
| Mar 24 | $140 | Asia coal-return headlines stack |
| Mar 27 (recent) | $141.65 | New 52-week high |
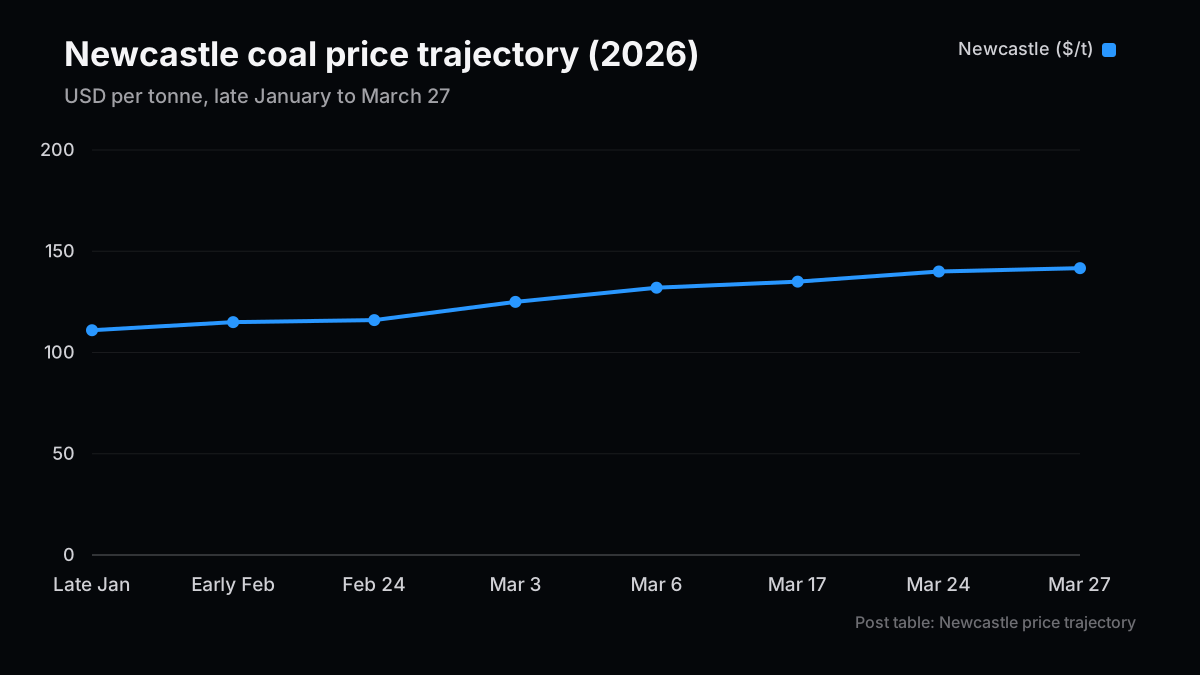
GMO's Lucas White has flagged that a multi-month Hormuz closure could push coal another +46% higher.
Coal Names Worth Watching
This is where my CVC instincts cut hardest. Pick names by Seaborne exposure, metallurgical-coal share, and contract vs. spot mix — those are the three that matter, in my view.
Peabody Energy (NYSE: BTU)
America's largest private coal producer. PRB and Illinois Basin domestically, plus Seaborne thermal and metallurgical operations in NSW and Queensland — directly positioned for Asian demand. The stock jumped +7.9% on March 24 to close at $38.19.
The asset I'd most highlight is the Centurion mine — a $750M investment that started longwall production in February 2026 (two months ahead of plan), targeting 3.5 mt of premium HCC in 2026 and 4.7 mt by 2028. Met coal is a structural premium business with very different supply-demand dynamics from thermal coal. 2026 shipment guidance: 12.5 mt Seaborne thermal, 10.8 mt metallurgical. Cash on hand $575M; total liquidity $900M+.
Whitehaven Coal (ASX: WHC.AX)
NSW-based, high-quality low-impurity thermal and met coal, sold across Japan, Korea, China, India, Taiwan, Southeast Asia, and Europe. Q2 2026 production rose +21% q/q to 11 mt, with Narrabri up +48%. Unit cost down to AUD 135/t, net debt down by AUD 100M. Stock at AUD 8.915 — top of the AUD 4.26–9.60 52-week range.
Other names worth watching
Warrior Met Coal (NYSE: HCC) — Alabama-based pure-play premium HCC producer. Met coal has its own demand cycle, distinct from thermal, and pricing power holds as long as Asian steel demand stays bid.
Alliance Resource Partners (NASDAQ: ARLP) — Illinois Basin and Appalachia coal MLP. High-yield ($4.21 per common unit distributed in 2025) — built for income investors.
Natural Resource Partners (NYSE: NRP) — A royalty model. Doesn't mine; collects mineral rights lease income, so operating risk is low. 2025 free cash flow $169M; debt paid down $109M.
| Ticker | Name | Listing | Mkt cap | Profile | Post-war move |
|---|---|---|---|---|---|
| BTU | Peabody Energy | NYSE | ~$4.0B | US #1; Australia Seaborne + PRB | +17%↑ |
| WHC.AX | Whitehaven Coal | ASX | ~AUD 9B | High-quality NSW; direct Asia sales | +22%↑ |
| HCC | Warrior Met Coal | NYSE | ~$3.5B | Alabama premium HCC pure-play | +12%↑ |
| ARLP | Alliance Resource | NASDAQ | ~$3.2B | High-yield US MLP | +8%↑ |
| NRP | Natural Resource Partners | NYSE | ~$1.3B | Royalty model; low op risk | +10%↑ |
US thermal demand is structurally declining per EIA, but met coal exports are forecast to rise in 2026 — and BTU (via Centurion), HCC, and WHC have the most direct exposure to that.
Scenario Strategy & Outlook
The biggest call in this piece: coal stocks should be held as a tactical trade, not a structural long.
Scenario analysis
| Scenario | Newcastle range | Brent outlook | Implication for coal stocks |
|---|---|---|---|
| Base (ceasefire by April) | $120–$140/t | $80–$90/bbl | Profit-taking; downside risk |
| Main (conflict continues months) | $145–$200/t | $100–$120/bbl | Further upside for BTU/WHC: +30–40% |
| Tail (unresolved by year-end) | $180–$260/t | $120–$150/bbl | 1970s-style energy crisis; stagflation |
Short term: relative-long inside the energy sector
Note the macro: Brent above $112; S&P 500 down −7% from highs; Nasdaq off −10%+. Sticky energy inflation has pushed central-bank cuts back, and "higher for longer" is alive again.
In this regime, holding coal stocks as an outright market long is more dangerous than it looks. The sharper expression is a relative-long inside the energy sector — paired against renewables or demand-sensitive shorts. From investment-committee experience, "naked" longs in this kind of environment are the ones that bite later.
Medium-to-long term: the paradoxical accelerator for renewables
Counterintuitively, this crisis is the clearest accelerator for renewable and electrification investment in years. Birol said it bluntly: "Solar isn't a romantic story anymore — it's a business." Ember's research lead added: "Electrotech gives countries the tools to remove imported fuels entirely."
After Russia-Ukraine in 2022, European solar deployments doubled — then slowed when rates rose. This crisis re-cements the equation energy security = domestic energy = renewables. Decarbonization themes such as efficiency and fuel switching move up the urgency scale in lockstep, in my view.
Watch items going forward
- April 6 deadline — Trump's demand for Hormuz reopening. The post-deadline US response (resumed strikes on Iranian power infrastructure or not) is the largest single catalyst.
- Ras Laffan repair timeline — Does the 3–5 year estimate get hardened? That sets long-term LNG structure.
- IEA emergency stock release scale — Members agreed on a 400 mb release; the drawdown pace is the principal price-floor input.
- China dynamics — RMB-denominated "transit fee" reports from Iran. Expansion suggests an entrenched fragmentation of energy flows.
- Indonesian export policy — As the world's largest exporter, even small policy nudges feed straight into Newcastle.
Bottom line: short-term long, medium-term neutral. Coal stocks are a tactical trade on the Iran crisis — not a structural long. But the "import-dependence risk" this crisis has exposed will accelerate investment urgency in distributed energy, battery storage, and transport decarbonization. The seeds of the next structural shift live inside this crisis.
Next Issue Ideas
- Idea 1: A data-updated follow-up — Revisit the thesis with fresh numbers and separate what strengthened from what broke.
- Idea 2: A practical template edition — Turn the article into a checklist readers can reuse for investing, pricing, or technical operations.
- Idea 3: The bear-case test — Define the conditions that would invalidate this view and map the indicators to watch next.
Related Posts
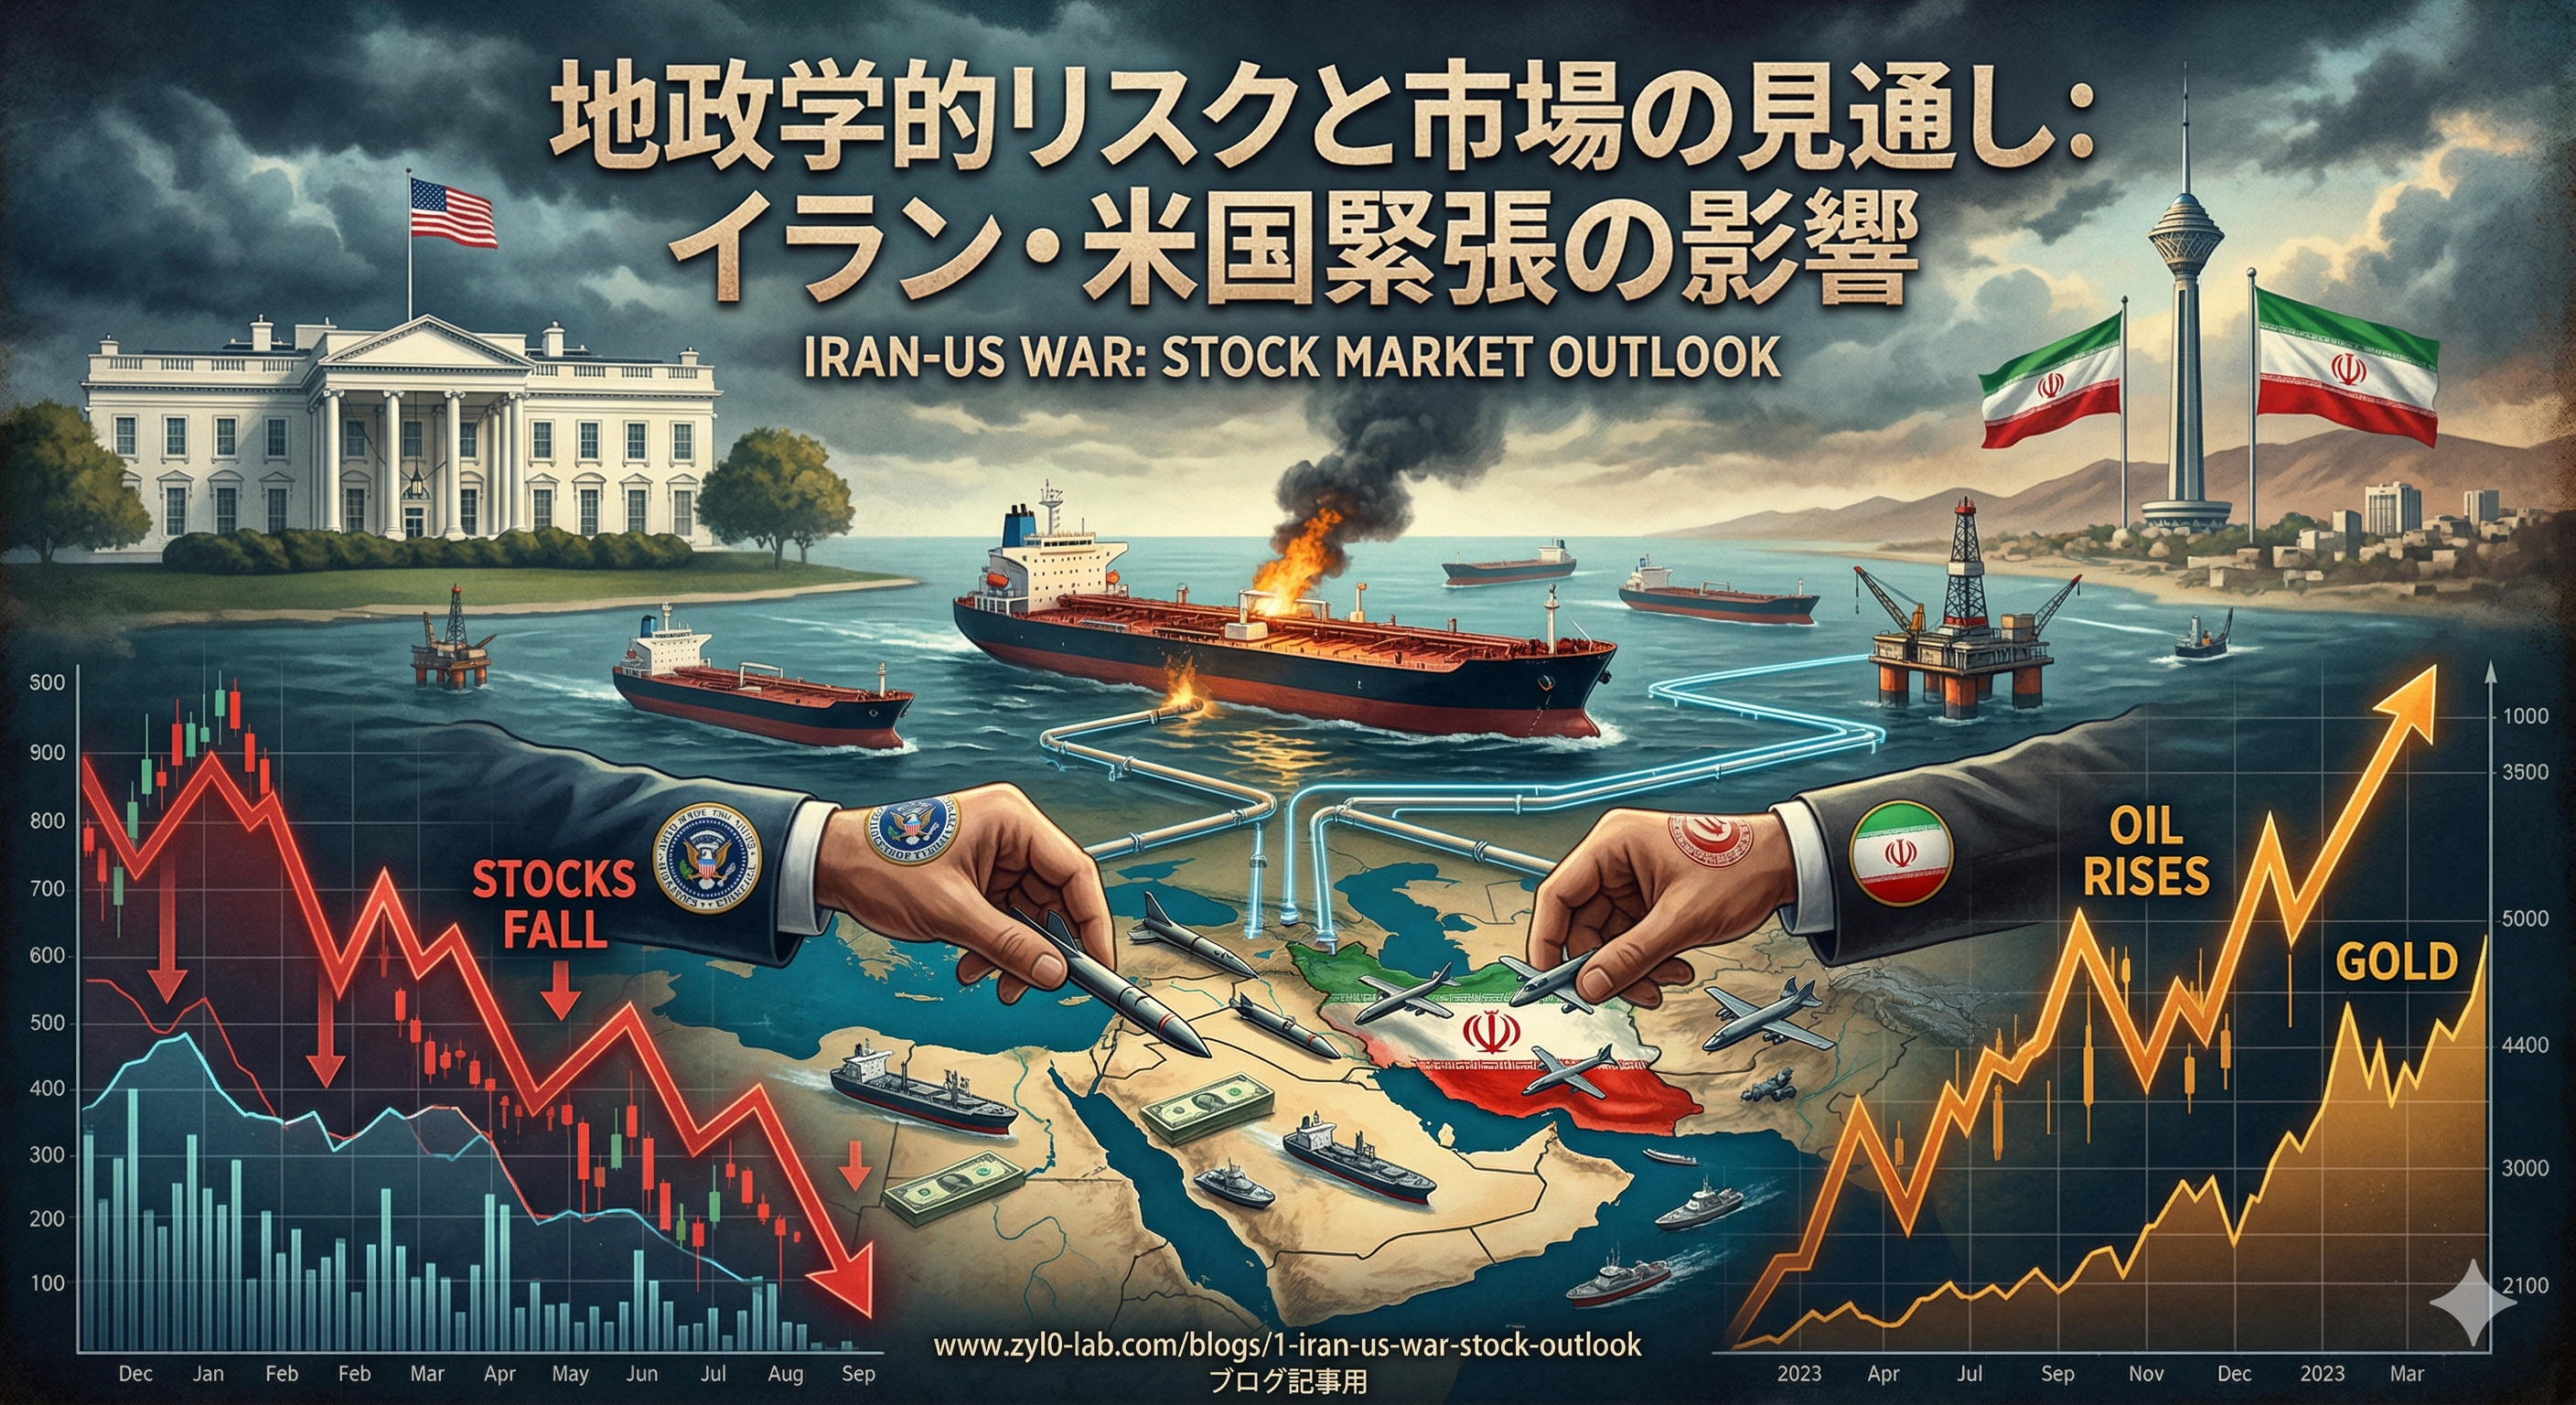
- US Stock Market Outlook: Iran-US Tensions — The scenario framework for how Iran-US tensions reprice US equities, sector by sector.
- Oil's New Map, Six Months Into the Iran War — Part 1: How Routes and Stockpiles Actually Shifted — The follow-up that resolves this post's open watch items, including the April 6 deadline and the IEA's 400-million-barrel release, against six months of actual data.
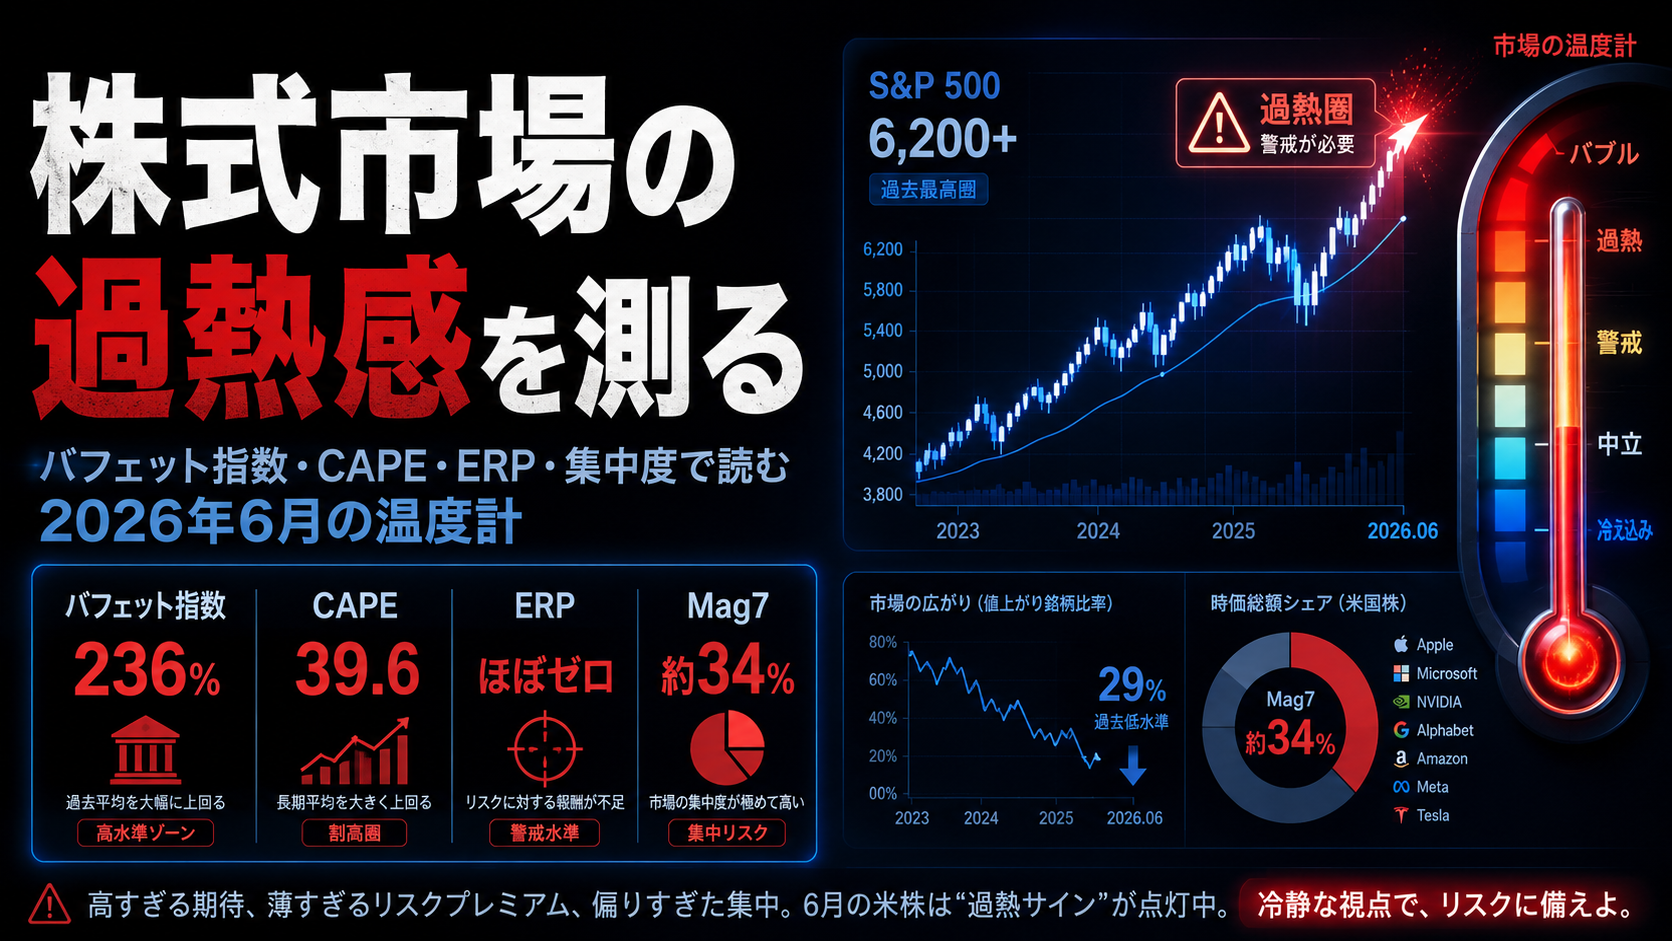
- Measuring Stock-Market Froth: Reading June 2026 Through the Buffett Indicator, CAPE, ERP, and Concentration — Measures how stretched the US market was on valuation when this energy shock hit.
- The Warsh Shock — Part 1: How Jackson Hole Rewired the Rate and Dollar-Yen Outlook — Carries this post's early "higher for longer" rate view forward into the actual post-Jackson-Hole rate scenario.
References
The factual and numerical assumptions in this article are anchored to primary or public materials that readers can revisit during AdSense review and future updates.
- U.S. Energy Information Administration coal data
- International Energy Agency coal market reports
- U.S. Treasury sanctions programs and country updates
This article is for informational purposes only and does not constitute investment advice or a recommendation of any specific stock, service, or contract structure. The author may hold positions or interests related to companies or services mentioned. Generative AI was used for parts of research, translation, and proofreading, with final review by ZYL0. See the disclaimer for details.