Cloud Revenue Doubled at the Top, Yet Three of Four Can No Longer Fund Their Capex: Big Tech's July-September 2026 Earnings on One Definition
Azure grew 48%, Google Cloud doubled and AWS rose 39%, yet the four biggest spenders paid out 115% of their operating cash flow as capex, and three can no longer fund it themselves. A same-definition read of the July-September 2026 earnings.

Azure grew 48%, Google Cloud doubled and AWS rose 39%, yet the four biggest spenders paid out 115% of their operating cash flow as capex, and three can no longer fund it themselves. A same-definition read of the July-September 2026 earnings.

This is an outside-in read based only on public information. I did not interview any company or use non-public material. Data checked on October 30, 2026 (Asia time), before Amazon's next-day close was available. Ratios are my own calculations, not company metrics.
On October 29, Alphabet's stock fell 12.64% in a single session. The results it reported the night before showed Google Cloud revenue doubling from a year earlier. Microsoft, reporting the same evening, grew Azure 48% and still closed down 0.16% the next day. The following evening Amazon announced 39% growth at AWS and dropped more than 7% after hours.
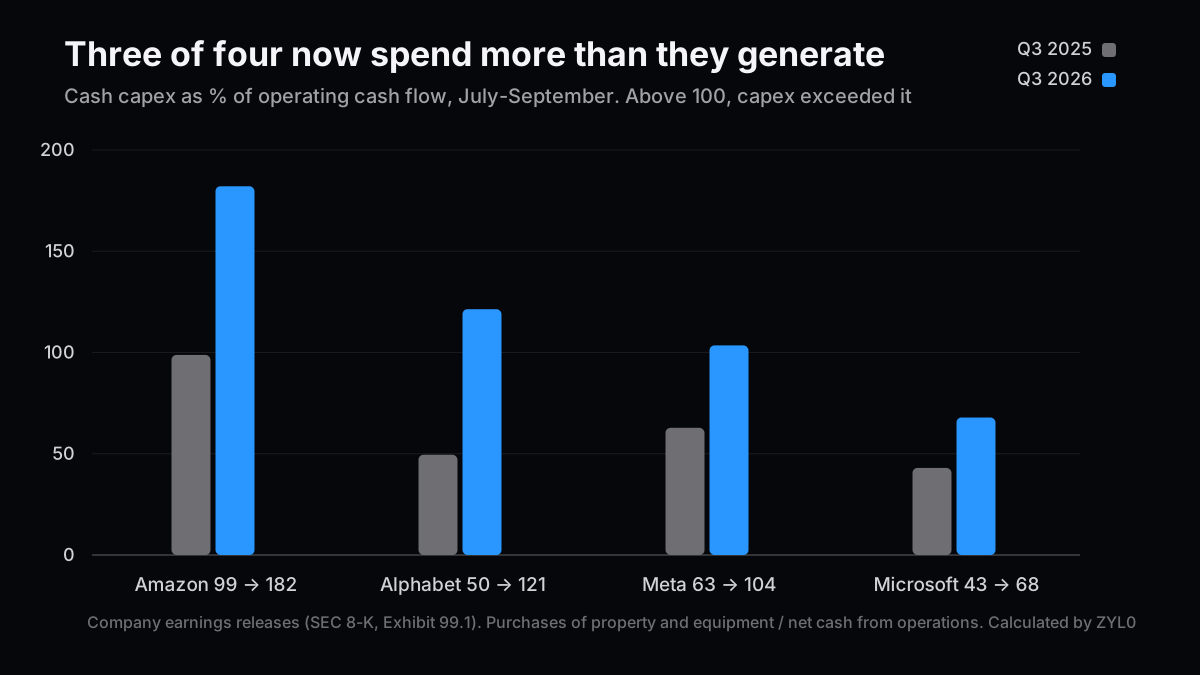
Cloud growth does not explain those gaps. Put all four big spenders on one cash definition and a different number stands out: capex reached 115% of operating cash flow. A year ago it was 61%.
In September's piece restating capex on one definition, I wrote that two of the four could not cover capex from operating cash flow in the April-June quarter. One quarter later Meta has joined them, which makes three. My last post on the AI bond rush looked at the price of the money. This time I wanted to go through the cash lines and see why they need so much of it.
Microsoft, Alphabet and Amazon reported this week. Meta reported a week earlier, on October 21, and I include it so all four cover the same quarter. Apple is due on November 2 and has no numbers yet, so it stays out.
On the Numbers Alone, the Three Clouds Are Hard to Fault
Looking only at cloud, this was a strong set of results. I struggled to find a reason for gloom here.
| Cloud | Revenue ($bn) | YoY | Added vs. last year ($bn) | Operating margin | Backlog ($bn) |
|---|---|---|---|---|---|
| AWS | 46.0 | +39% | +13.0 | 38.7% (34.6% prior) | 578 (reported as more than double in a year) |
| Azure | 33.2 | +48% | +10.8 | Not disclosed | 677 (Microsoft-wide commercial RPO, +73%) |
| Google Cloud | 30.7 | +103% | +15.6 | 36.2% (23.7% prior) | 561 (just over 55% due within 24 months) |
The smallest of the three added the most revenue.
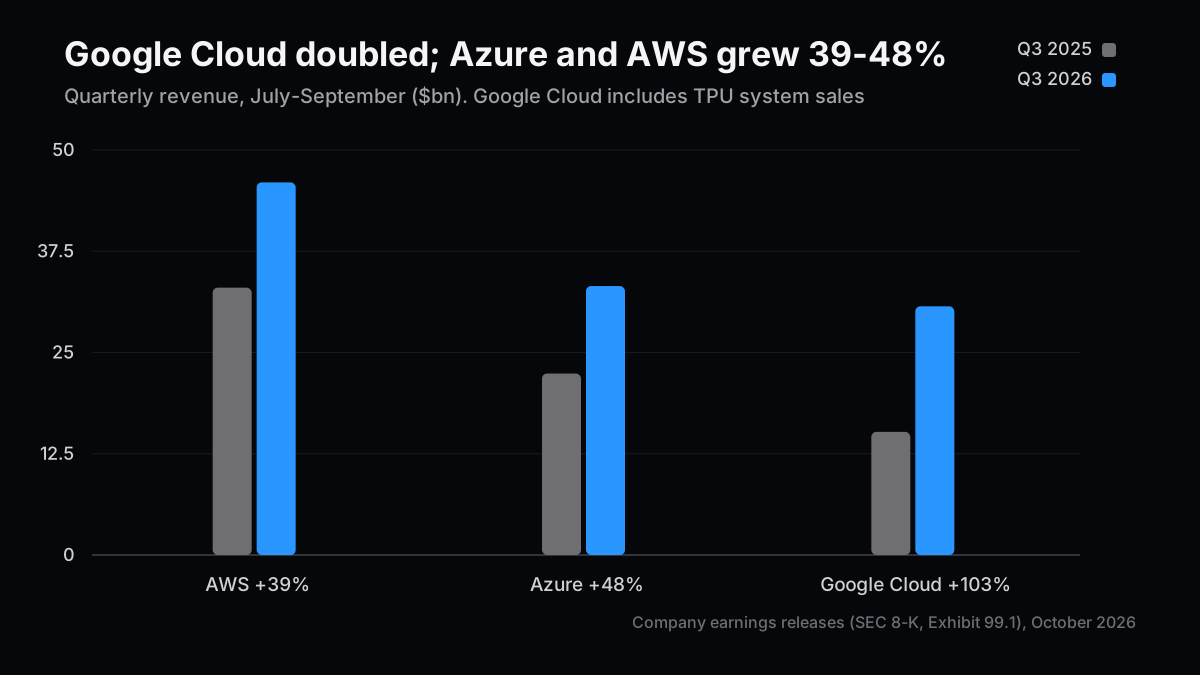
Google Cloud's doubling is not a clean comparison, though. It includes system sales of TPUs, Google's in-house AI chips. According to a summary of the call, the CFO gave no product-level figures and described growth excluding TPU systems only as "very strong," adding that more sales are expected through 2027. Cloud usage fees and one-time hardware sales do not recur the same way. I read that doubling with a sizable asterisk.
The backlogs are enormous too. Together they come to about $1.8 trillion, but the definitions differ. Microsoft's $677 billion is company-wide commercial remaining performance obligation, not Azure alone. None of them discloses how concentrated it is by customer. As I noted last time, about half of Oracle's backlog has been reported as OpenAI. How much of the same pattern sits in these numbers cannot be seen from the outside.

Backlog only becomes revenue after the equipment goes in. Microsoft says demand still exceeds supply, and Amazon projects AWS growth above 40% in both 2027 and 2028. Finding customers is not the issue. The issue is what has to be paid before they can be billed.

On One Definition, Three of Them Pay Out More Than They Generate
This is the core of the piece. As in September, I took only the purchases of property and equipment line from each cash flow statement and ignored the capex figures quoted on calls.
| July-Sept 2026 ($bn) | Microsoft | Alphabet | Amazon | Meta |
|---|---|---|---|---|
| Revenue | 92.3 | 127.6 | 201.9 | 64.6 |
| Revenue growth | +19% | +25% | +12% | +26% |
| Operating income | 45.9 | 40.6 | 28.1 | 13.0 |
| Operating cash flow | 58.0 | 42.3 | 42.4 | 32.8 |
| Cash capex | 39.4 | 51.4 | 77.3 | 33.9 |
| Gap (operating CF - capex) | +18.6 | -9.1 | -34.8 | -1.2 |
Amazon's $77.3 billion jumps out. It was $35.1 billion a year ago, so it has more than doubled. Amazon has by far the largest revenue of the four, yet its operating cash flow is about the same as Alphabet's, and only capex has broken away.
Ratios make the year's change clearer.
| Capex / operating CF | Q3 2025 | Q2 2026 | Q3 2026 | Share of revenue (Q3) |
|---|---|---|---|---|
| Microsoft | 43.0% | 64.6% | 67.9% | 42.7% |
| Meta | 62.8% | 94.5% | 103.5% | 52.5% |
| Alphabet | 49.5% | 115.0% | 121.4% | 40.3% |
| Amazon | 98.8% | 119.4% | 182.1% | 38.3% |
| Four combined | 61.2% | 96.1% | 115.1% | — |
Across the four, $201.9 billion of cash went into equipment and buildings this quarter, against $175.5 billion of operating cash flow.
Two notes on definitions. The free cash flow each company reports is calculated a little differently. Meta also subtracts finance lease principal, giving -$2.1 billion. Amazon adds back sale proceeds and incentives, which works out to about -$33.5 billion for the quarter (it discloses only the trailing 12 months, -$42.4 billion). The sign does not change under any of them.
Separating the stated reason from the numbers
Alphabet's -$9.1 billion took me back to my days in semiconductor process development. A yield problem had been reported as an equipment issue, and when I worked through it in simulation the root cause was somewhere else. Ever since, I have split a stated reason apart with numbers before accepting it.
According to the call summary, Alphabet pointed to capex plus an inventory build for TPU sales, and said a $5.2 billion EC fine payment weighed on operating cash flow. So is it a one-off? Strip out the fine and it is still about -$3.9 billion. The inventory piece is not disclosed, so I cannot isolate it. Trailing 12-month free cash flow is still positive at $19.7 billion. My read: one-offs deepened the quarter, but capex is the main character.
Earnings need the same treatment. Alphabet's $2.12 of EPS includes a loss of about $8.7 billion on equity securities, worth $0.55 a share. Meta's 20% operating margin includes a $9.89 billion legal charge. Excluding it I get 35.4%, still below last year's 40%.
Microsoft's positive number needs a caveat as well. Capex including finance leases was $45.2 billion, and the CFO said some third-party capacity deliveries slipped. Next quarter should top $50 billion, with about $170 billion for the calendar year. Part of that $18.6 billion cushion is timing. Even so, the CFO expects to stay free cash flow positive in fiscal 2027.
What Did the Stocks React To?
Honestly, this is the part that gave me the most trouble. It would be tidy to say they fell because free cash flow went negative, and I can't quite say that.
| Company | Reported | Against expectations | Stock move |
|---|---|---|---|
| Microsoft | Oct 28 | Azure 48% (about 45% expected); adjusted EPS $4.89 ($4.73) | About +4% after hours, then -0.16% at next close |
| Alphabet | Oct 28 | Revenue $127.6bn (about $128bn); EPS $2.12 (nearly $3.00); Cloud beat | -12.64% at next close ($283.82) |
| Amazon | Oct 29 | EPS $1.89 ($1.97); capex reported about $20bn above expectations | -7.30% after hours (last trade before 8 p.m. ET) |
| Meta | Oct 21 | Revenue $64.6bn ($63.4bn); $9.89bn legal charge | Down nearly 7% the next day (CNBC) |
Estimates are as reported and vary by data provider. Price moves come from StockTitan's tally, CNBC and Reuters.
Two things stand out.
First, all three companies with negative free cash flow were sold. Reuters described Alphabet's drop as a revenue miss compounded by faster cash burn. But Alphabet also missed on EPS, even at $2.67 excluding the investment loss, and Amazon disappointed on EPS and on its fourth-quarter sales guide. I am not claiming cash was the only reason. This is four companies and one quarter, and causation is beyond what it can show.
The second interests me more. Microsoft beat estimates and generated positive free cash flow, and its 4% after-hours gain still vanished by the next close. Running short of cash gets you sold, but having enough does not get you bought. The market looks less like it is hunting for an AI winner and more like it is re-weighing the cost of the whole build-out. The S&P 500 fell 0.30% that day and the Nasdaq 1.37%.

How the Shortfall Gets Filled
If cash runs short, it has to come from outside. Meta made the biggest move of the week here.
Five days after its results, Meta started selling equity. According to the prospectus, it sold $12.5 billion of depositary shares linked to 6.50% mandatory convertible preferred stock, a deal that closed on October 29. It also entered forward sale agreements on 40 million Class A shares, with about $24.9 billion of net proceeds expected. Those settle by November 19, 2027, so the cash does not arrive right away. Press reports describe up to $60 billion more in share sales from early 2027, which I did not find in the filings I checked.
| Company | 2026 capex plan | Said about 2027 | Main outside funding |
|---|---|---|---|
| Microsoft | About $170bn, calendar year, with leases | Accelerating in the second half, led by CPUs | No large 2026 bond deal found |
| Alphabet | $195-205bn | Significantly higher; details next quarter | Bonds ($20bn plus $31.8bn in other currencies in H1) and June equity ($49.6bn net) |
| Amazon | About $220bn, cash basis | Reported as meaningfully more | Bonds ($37bn plus EUR 14.5bn in March) |
| Meta | $135-145bn, with lease principal | Investing aggressively; budget not set | Bonds and this equity deal (about $37.4bn combined) |
The midpoints add up to about $730 billion, on definitions that do not match.
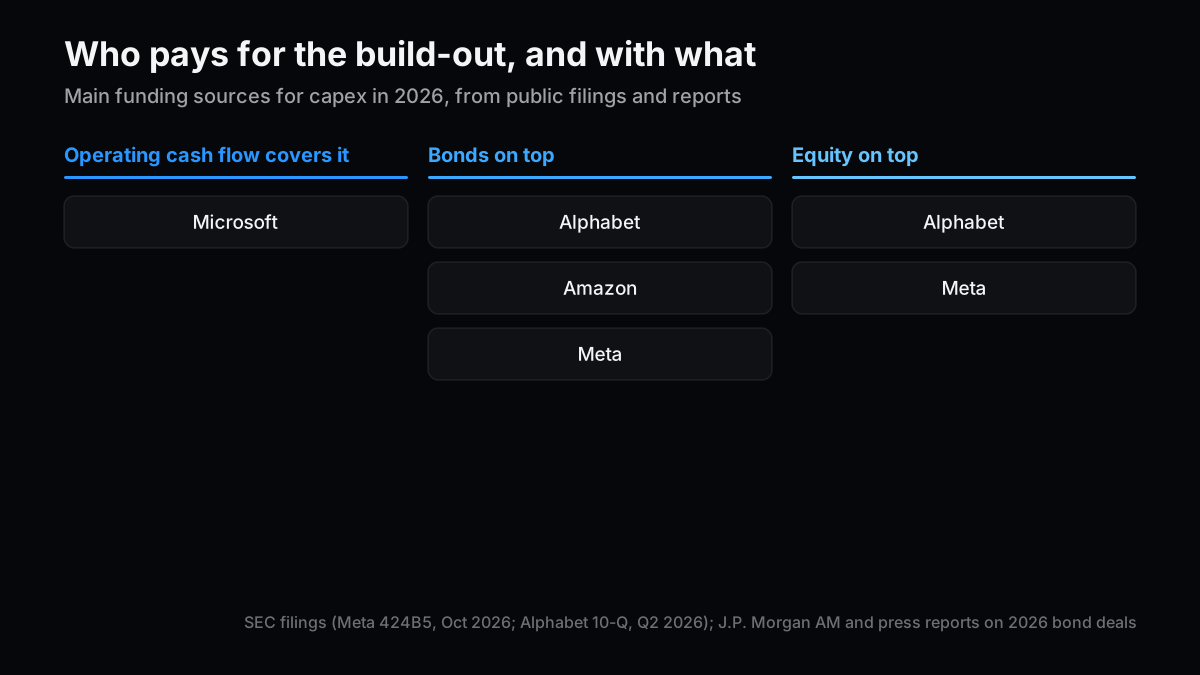
Checking this against my last post, two things are worth recording.
The Fed held its target range at 3.75-4.00% on October 28. That matches my base case, but the vote was 10-2, and both dissenters wanted a hike. There is still no sign of money getting cheaper.
The other is equity. Last time I leaned long on high-grade hyperscaler bonds over the medium term, and raising equity helps bondholders, since shareholders take on part of the load. Nothing in these results changes that view. For shareholders it reads the other way: AI spending used to be a question of how to use profits, and now it is plainly a question of dilution.

Scenarios and My Investment Call
Here is how I would frame the next six to twelve months. The probabilities are my own judgment.
| Scenario | Probability | What happens | Early signals |
|---|---|---|---|
| Base case | 50% | 2027 capex rises again and the three stay negative. Cloud growth holds and bonds and equity fill the gap | 2027 capex figures arrive in January-February; capex stays above 100% of operating CF |
| Main scenario (upside) | 20% | New capacity starts turning into revenue and operating cash flow catches up. Someone drops below 100% in the second half of 2027 | Backlog converts faster; cloud margins absorb rising depreciation |
| Tail risk | 30% | A large customer's funding thins and backlog quality comes into question. Funding terms worsen, plans get cut, and it spreads to chips and power | A backlog falls quarter on quarter; new bond spreads widen; a December hike |
I put the tail at 30% because customer concentration in these backlogs cannot be seen from outside. I think it has the same root as the neocloud credit problem in my last post.
Investment call
- Microsoft: neutral in the short term, leaning long over the medium term. It is the only one of the four inside its operating cash flow, though I discount the part of the cushion that comes from delayed deliveries
- Alphabet: wait and see in the short term, leaning long over the medium term. Its cloud growth and margin gains are the strongest. I see no reason to rush until it is clearer how durable TPU sales are
- Amazon: leaning negative in the short term. At 182% it stands far apart from the others, and spending is reported to rise further in 2027. I want to see AWS's 40%-plus in the numbers first
- Meta: neutral. Advertising is strong, but with no outside cloud business the payback depends on its own ads, and this equity deal puts dilution in view
- High-grade hyperscaler bonds: still leaning long over the medium term. I am not changing last month's call. Equity raises work in bondholders' favor
What would change my mind
If, in the January-February results, at least two of the three negative companies cover capex from operating cash flow without giving up cloud growth, I will accept that this cash squeeze was temporary. In the other direction, if Microsoft cannot stay free cash flow positive during fiscal 2027, I will mark down my view of all four. The same goes if any of them reports a backlog that shrinks quarter on quarter.
Watch points
- How higher memory and component costs show up in Apple's results on November 2
- Interest costs and funding plans in the neoclouds' November results
- Treasury's quarterly refunding in November
- Whether the Fed hikes in December
- The 2027 capex figures each company gives in January and February
One doubt stays with me. I do not know how much of Google Cloud's doubling is TPU sales. Knowing that would change my read of Alphabet and of the three-way cloud comparison. For now, the honest thing is to say I don't know.
Related Posts
- Big Tech AI Capex Is Not Comparable As Reported — the April-June quarter on the same definition
- Did the AI Bond Rush Push Up Long-Term US Yields? — the bonds that fill the gap, and what they cost
- Meta, Amazon, Google and Microsoft Q1 2026 Earnings Compared — where the four stood two quarters ago
- The Warsh Shock — Part 2: How Far Rate Risk Reaches Into Tech Capex — the rates-to-capex analysis
References
- Microsoft FY27 Q1 Earnings Release (Microsoft, October 28, 2026)
- Microsoft FY27 Q1 Earnings Conference Call (Microsoft, October 28, 2026)
- Alphabet Q3 2026 Earnings Release (SEC 8-K, October 28, 2026)
- Amazon.com Q3 2026 Results (SEC 8-K, October 29, 2026)
- Meta Q3 2026 Results (SEC 8-K, October 21, 2026)
- Meta Prospectus Supplement (SEC 424B5, October 2026)
Next Issue Ideas
- Idea 1: Who is behind the $1.8 trillion backlog? — Build up customer concentration from filings and big-contract announcements, and find where the tail risk would actually start.
- Idea 2: Counting the borrowing that never shows up as bonds — Carried over from last time. Measure payments and lease obligations that barely touch the capex line, such as Microsoft's $7.4 billion of finance leases this quarter.
- Idea 3: Who receives the $200 billion? — About $200 billion of cash a quarter is flowing somewhere among servers, memory and power. Read it alongside November's chip earnings to find the supply-side angle.
This post is not investment advice. The author may hold securities of the companies mentioned. Generative AI was used in preparing it. Please read the disclaimer before making any investment decision.