AI Chip Earnings 2: 45% Growth and a 4% FCF Margin Put the Challenger to the Test
Examine the challenger economics of AI chips through Data Center growth, work in process, receivables and cash conversion, compared across three supply models.
Examine the challenger economics of AI chips through Data Center growth, work in process, receivables and cash conversion, compared across three supply models.

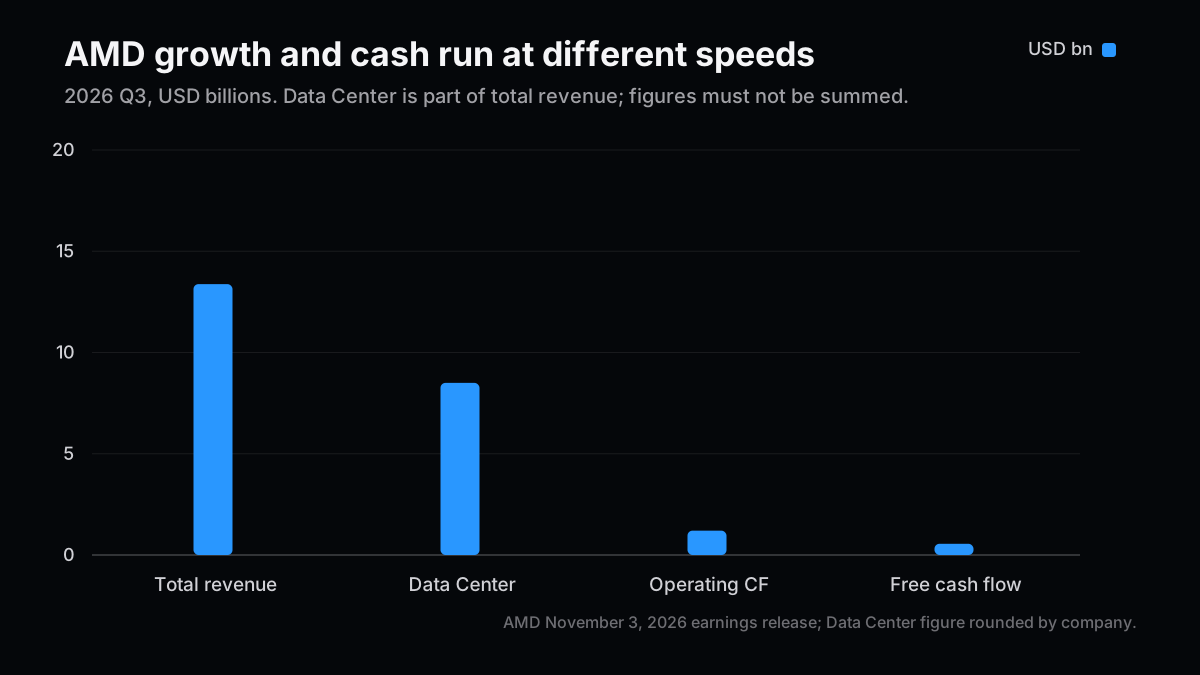
AMD grew 2026 Q3 revenue 45%, with Data Center up 97%, yet its FCF margin fell to roughly 4%. Expansion is visible. Conversion into cash available to shareholders has more catching up to do.
This article uses public information only, checked on November 7, 2026. AMD series, part 1 draws on the November 3 earnings release and November 4 Form 10-Q, with NVIDIA and Broadcom as comparators. Their fiscal periods and business mixes differ.
Post 75 examined why a rising asset balance needs a causal explanation. Semiconductor results require the same separation. Revenue growth, earnings growth and cash growth can occur at different speeds, particularly during a production ramp.
Data Center Leads While Gaming Moves the Other Way
Start with the composition of sales. Amounts are in billions of US dollars; segment figures retain the rounding used in the company announcement.
| 2026 Q3 item | Revenue | Year-over-year change | Interpretation |
|---|---|---|---|
| Consolidated | 13.377 | +45% | Total company growth |
| Data Center | About 8.5 | +97% | Includes both EPYC and Instinct |
| Client and Gaming | About 3.7 | −8% | PC and gaming demand diverge |
| Client within that segment | About 2.9 | +7% | Ryzen-related demand |
| Gaming within that segment | About 0.773 | −40% | Lower semi-custom and graphics sales |
| Embedded | About 1.1 | +29% | Recovery in another revenue base |
Data Center represents roughly 64% of consolidated revenue. That is meaningful, but $8.5 billion is not an AI GPU revenue figure. It includes server CPUs, preventing a clean GPU sales or market-share calculation.
Management identifies MI450, EPYC and Helios deployment as growth drivers. This establishes company-reported adoption. It does not establish every customer's production utilization or the scale of a cost advantage. A product appearing on a customer list is different from a workload earning an economic return.

Read Both the 21% GAAP Margin and the 29% Adjusted Margin
GAAP operating profit was $2.832 billion, versus $3.923 billion on a non-GAAP basis. The corresponding margins were 21.2% and approximately 29%. The useful task is understanding the bridge, rather than declaring one number the only real profit.
Stock compensation and acquisition-related intangible amortization receive different treatment in adjusted measures. Amortization can be non-cash in the current period without making the acquisition free. Stock compensation can preserve cash while diluting existing holders. Both distinctions matter for shareholder economics.
NVIDIA changed its treatment of stock compensation in non-GAAP measures beginning in FY2027. A cross-company adjusted-margin table therefore need not remove the same expenses. I use GAAP operating margins for the comparison below.
| Company and latest period | GAAP operating margin | Company-defined FCF margin | Remaining mix differences |
|---|---|---|---|
| AMD, 2026 Q3 | 21.2% | 4.1% | CPUs, GPUs, PCs and other products |
| NVIDIA, FY2027 Q2 | 66.2% | 22.2% | Integrated GPU-system exposure |
| Broadcom, FY2026 Q3 | 53.9% | 46.2% | Custom chips and software |
The gap is not a ready-made estimate of AMD's future margin opportunity. Products, contracts, customers and software economics differ. It describes present profitability and cash resources, not a common endpoint toward which all three businesses must converge.
Inventory Growth Sits in Work in Process
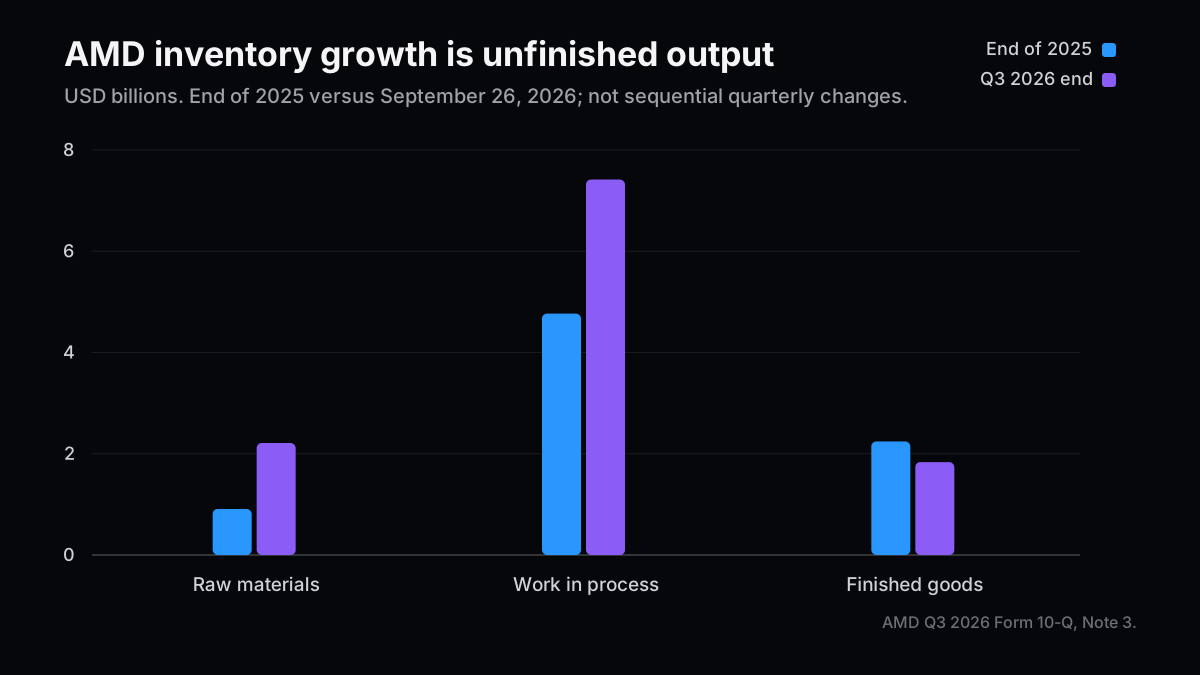
Ending inventory rose to $11.463 billion from $7.920 billion at the end of 2025. Finished goods actually declined.
| Inventory, USD billions | End of 2025 | End of 2026 Q3 | Change |
|---|---|---|---|
| Raw materials | 0.909 | 2.212 | +1.303 |
| Work in process | 4.768 | 7.416 | +2.648 |
| Finished goods | 2.243 | 1.835 | −0.408 |
| Total | 7.920 | 11.463 | +3.543 |
These are nine-month changes, not sequential quarterly changes. Work in process accounts for approximately 75% of the increase. The composition does not support simply labeling the balance an accumulation of unsold finished products.
My experience taking automotive products into volume production taught me that unfinished output can support future shipments or reveal a process delay. The balance alone cannot distinguish them. The relevant sequence is input, completion, shipment and collection.
AMD attributes the buildup primarily to expanding Data Center products. Declining finished goods is consistent with that explanation, but it does not guarantee future sales. Advanced manufacturing, packaging availability and customer commissioning dates can all change. Planned production then becomes capital tied up for longer than expected.


Working Capital Pays for Growth First
Q3 operating cash flow was $1.202 billion. After $648 million of capital spending, FCF was $554 million, down from $1.558 billion in the preceding quarter. Higher revenue and profit can coincide with weaker cash generation during expansion.
Across nine months, receivables absorbed $2.894 billion, inventory $3.543 billion, and prepaid expenses and other assets $2.061 billion. An increase in accounts payable supplied $4.483 billion in the opposite direction. These movements describe funding timing; they do not independently establish deteriorating contractual payment terms.
Management guides Q4 revenue to $17 billion, plus or minus 3%, and non-GAAP gross margin to 55%. That is a substantial sales ramp. It also requires moving unfinished output through completion, shipment and payment.
I would not grade the quarter solely on reaching $17 billion. Shipments can grow while receivables grow even faster. Operating cash flow can recover through a payable increase without a comparable improvement in collection. Understanding which mechanism produced the cash is as important as the headline amount.
This also explains why a low FCF quarter is neither a complete bearish thesis nor something to dismiss. The balance sheet can fund a successful ramp, but successful demand must eventually release cash from that balance sheet. Otherwise growth keeps requiring more financing.
The Challenger Does Not Need to Win Every Workload
NVIDIA brings an established software and connectivity platform. Broadcom combines customer-specific optimization with other cash-generating businesses. AMD offers an alternative spanning CPUs and GPUs. These are my categories drawn from public information.
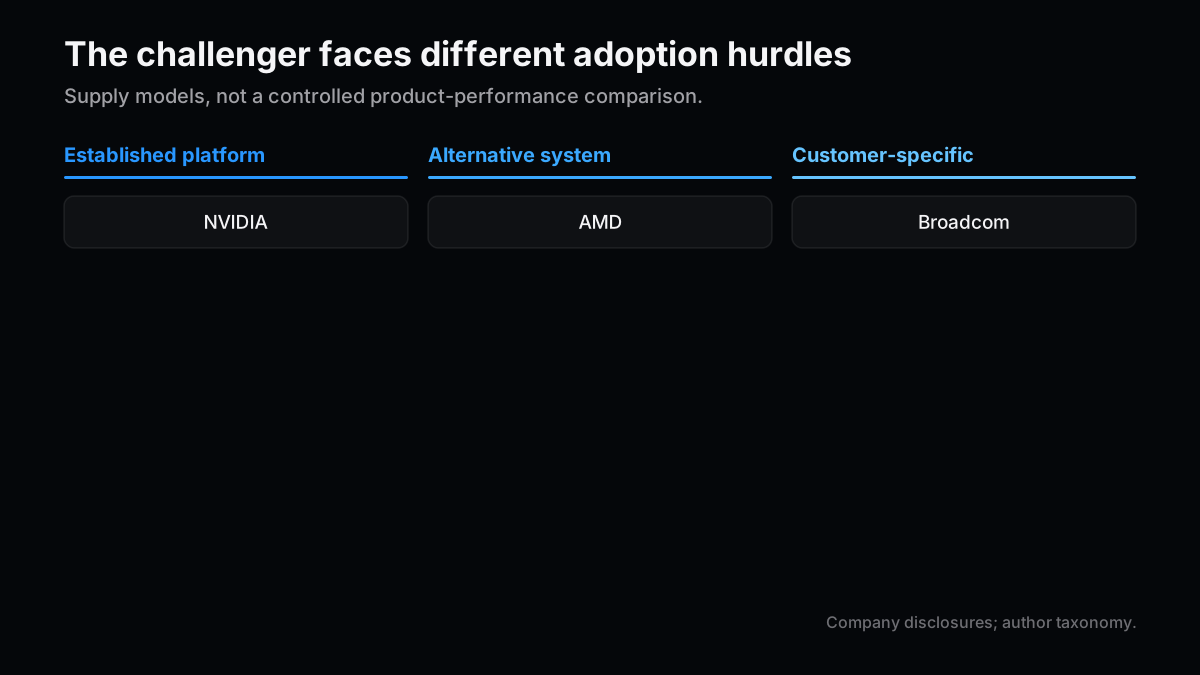
AMD does not need to replace every competitor deployment to build a valuable business. It needs workloads where customers find migration and operating costs worth paying. CPU and GPU growth together still do not reveal GPU-only share gains. Maintaining that distinction prevents the segment total from doing more analytical work than the disclosure supports.

Positive on Expansion, Waiting for Cash Confirmation
Data Center growth and higher GAAP operating profit support a positive medium-term business view. Near-term stock assessment remains neutral pending stronger cash conversion and a separate price assessment. I do not derive a share-price target from this release.
| Scenario | Evidence to watch | Cash and earnings effect | Assessment |
|---|---|---|---|
| Base case | Work in process ships and collection follows | Continued growth with FCF recovery | Positive medium-term business view |
| Main upside | Repeat utilization and profitable products expand | Margins and cash improve together | Grounds for upgrading the assessment |
| Tail risk | Deployment or shipments slip while inventory persists | Capital remains tied up; write-down risk rises | Reduce growth assumptions |
What would change my mind: slowing Data Center growth accompanied by continued accumulation of unfinished inventory and receivables. Conversely, several quarters of sales growth and FCF recovery would strengthen the interpretation that the present margin reflects a temporary ramp cost.
Over the next two quarters I will read work in process, finished goods, receivables and prepayments before the order headlines. The question is who prepays for growth, and how long that prepayment lasts. A compelling product roadmap should eventually produce an equally convincing cash record.
Related Posts
- AI Chip Investments 2: Acquisitions and Minority Investments — Technologies and capital supporting the ramp.
- AI Chip Earnings 1: Profit Versus Cash — Comparison with the leading supplier.
- Three Places an Asset Spreadsheet Goes Wrong — Separating a rising number from its cause.
References
- AMD 2026 Q3 results and FCF reconciliation, November 3, 2026
- AMD 2026 Q3 Form 10-Q, November 4, 2026
- NVIDIA FY2027 Q2 results and non-GAAP definitions
- Broadcom FY2026 Q3 results
Next Issue Ideas
- Idea 1: Two Quarters From Work in Process to Cash — Track working capital at three or more chip suppliers using consistent period-end balances.
- Idea 2: What Customers Pay for a CPU–GPU Alternative — Compare migration, operating and electricity costs.
- Idea 3: Does Specialized Inference Improve Profits? — Examine workload allocation and update costs across general-purpose, custom and specialized silicon.
This article is not investment advice. The author may hold securities mentioned. Generative AI assisted its preparation. Please read the disclaimer before making an investment decision.