AI Chip Earnings 1: 106% Growth Meets the Cash Test Across Three Suppliers
Compare three AI chip suppliers on revenue, operating profit and cash conversion to separate strong demand from the financing cost of growth.

Compare three AI chip suppliers on revenue, operating profit and cash conversion to separate strong demand from the financing cost of growth.

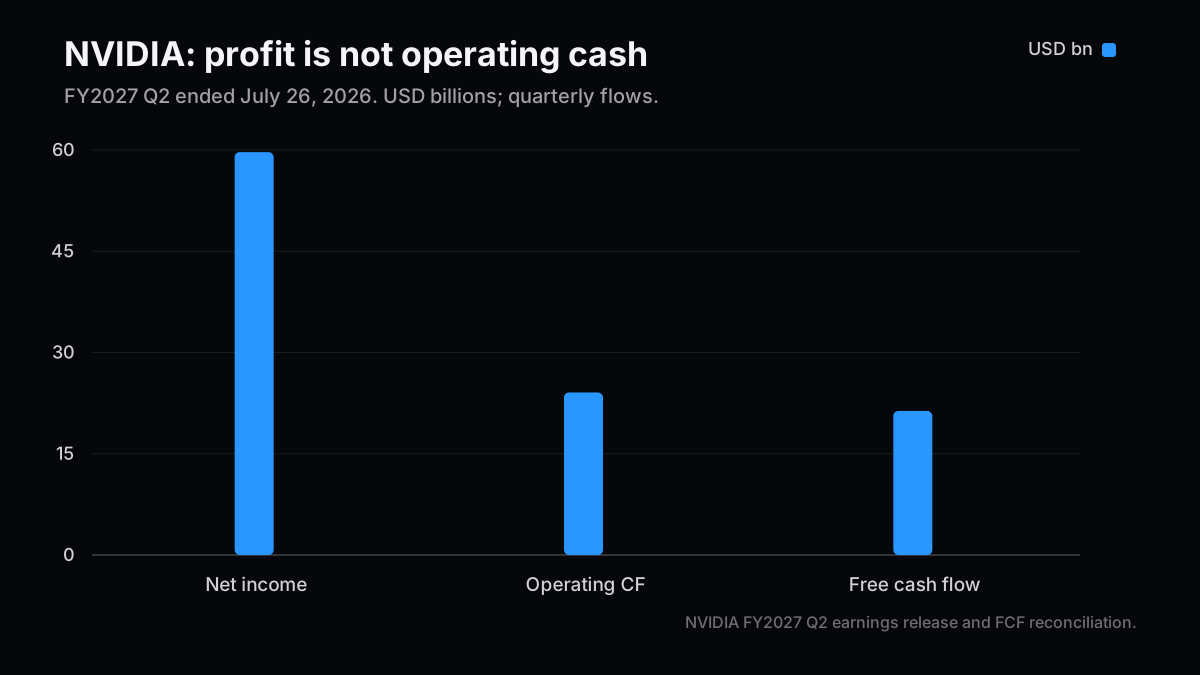
NVIDIA grew quarterly revenue 106% year over year, yet operating cash flow came to roughly 40% of net income. Demand is strong; cash collection is moving on a different timetable. An assessment of AI chips needs both numbers.
This article uses public information only, checked on November 7, 2026. NVIDIA series, part 1 compares its FY2027 Q2 with the latest results from AMD and Broadcom. Fiscal periods differ; these are not matched calendar-quarter observations.
Post 76 examined how power and funding constrain AI infrastructure. This time I turn to the suppliers. A customer can secure funding, accept equipment and settle its invoice on three different dates. Revenue and cash need not arrive together.
Start With Numbers That Can Actually Be Compared
Amounts below are in billions of US dollars and come from company earnings releases. Consolidated revenue includes businesses outside AI.
| Company and period | Revenue | Year-over-year growth | GAAP operating profit | Operating margin | FCF |
|---|---|---|---|---|---|
| NVIDIA FY2027 Q2, ended July 26 | 96.221 | +106% | 63.734 | 66.2% | 21.341 |
| AMD 2026 Q3, ended September 26 | 13.377 | +45% | 2.832 | 21.2% | 0.554 |
| Broadcom FY2026 Q3, ended August 2 | 29.591 | +86% | 15.955 | 53.9% | 13.665 |
FCF follows each company's definition. The treatment of capital spending and lease principal can differ, as does the business mix. This is an entry point for investigating cash conversion, rather than a perfectly standardized ranking.
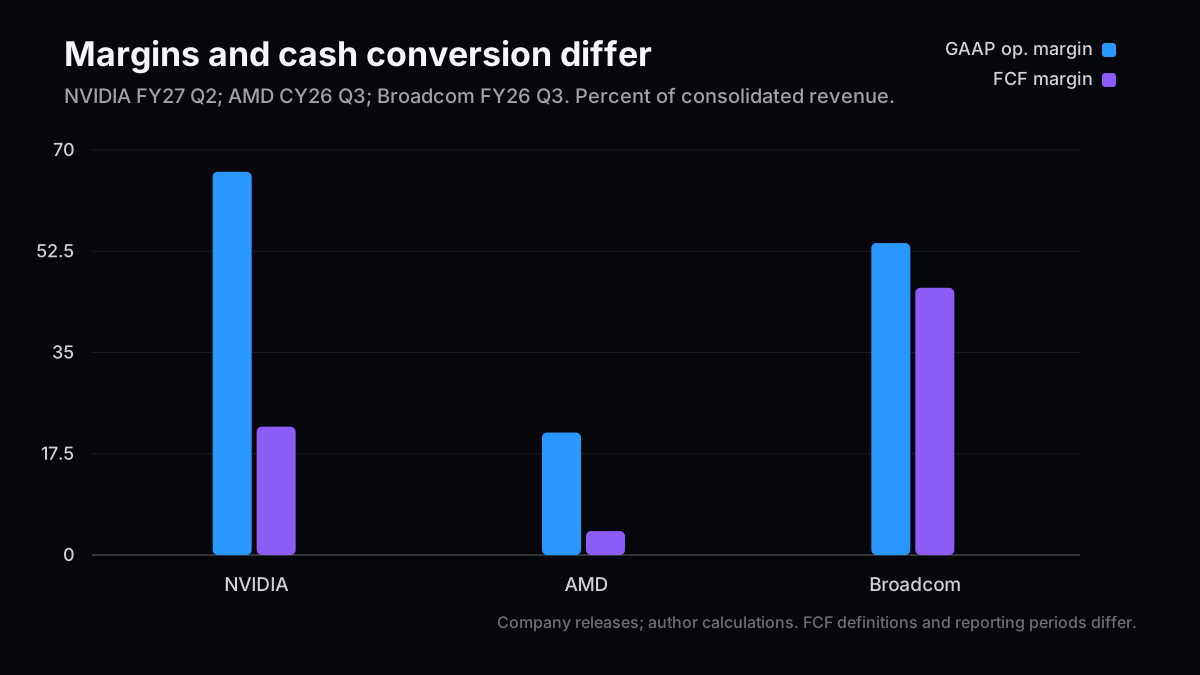
Broadcom owns infrastructure software; AMD sells PC, gaming and embedded products. NVIDIA Data Center revenue and Broadcom AI semiconductor revenue also cover different products. Dividing those figures into an assumed common market would create an unreliable market-share estimate.
My first comparison is therefore within each business: is cash keeping pace with earnings? Competitive position and funding efficiency are separate questions, even when they appear in the same table.

The Strength Is Scaling Revenue at a 75% Gross Margin
NVIDIA reported a 75.0% GAAP gross margin and $89.0 billion of Data Center revenue. The remarkable combination is scale and profitability together. Consolidated sales rose from $81.615 billion in the preceding quarter to $96.221 billion without sacrificing that margin.
EPS needs more care. GAAP EPS of $2.46 exceeded non-GAAP EPS of $2.22. Assuming that adjusted earnings must always be higher would misread the release. Investment-related items and their tax effects can move the relationship in either direction. The reconciliation matters more than the label.
There is another comparability change: beginning in FY2027, NVIDIA no longer excludes stock-based compensation from its non-GAAP measures. The historical figures in this release were updated accordingly. Mixing an older presentation with the new release can manufacture a misleading growth rate.
During automotive EEPROM process development, I used TCAD to investigate a yield problem initially attributed to equipment. The initial category risked deciding the answer before the investigation began. I bring the same habit to financial labels: inspect what is inside an adjustment before assigning it economic meaning.
Net Income of $59.7 Billion Did Not Mean Equivalent Cash
The cash statement gives a different view of the same quarter.
| NVIDIA FY2027 Q2 item | USD billions | Interpretation |
|---|---|---|
| GAAP net income | 59.688 | Can include non-cash investment-related items |
| Operating cash flow | 24.077 | Cash generated by operating activities |
| Property, equipment and intangible purchases | 2.677 | Deducted in company FCF |
| Related principal payments | 0.059 | Also deducted |
| FCF | 21.341 | Calculated above; 22.2% of sales |
| Receivables-related operating cash outflow | 22.346 | Quarterly cash-statement movement |
Operating cash flow divided by net income was 40.3%. That is a question to investigate, not evidence of accounting misconduct. Rapid growth can absorb working capital, while non-cash investment gains can raise reported profit without generating operating cash. Several mechanisms can operate at once.
Ending receivables of $63.059 billion divided by quarterly revenue and multiplied by an illustrative 91 days gives about 60 days. This is a rough ending-balance proxy, not a formal average-balance collection metric. It cannot establish that contractual payment terms changed. Applied consistently, however, it can flag a widening collection gap worth examining in the next filing.

Broadcom's 46.2% FCF margin provides a useful contrast, though software contributes to its mix. It does not demonstrate that its chips are inherently superior. AMD's 4.1% also requires context around inventory and prepayments during a production ramp. Buying all three as identical beneficiaries of AI demand would conceal different funding burdens.
The distinction matters when expectations are high. A supplier may produce excellent hardware, recognize impressive sales and still need more time to collect the associated cash. Shareholders ultimately need that final step, especially when the same supplier is also investing in its customers.

GPUs, CPUs and Custom Silicon Sell Different Advantages
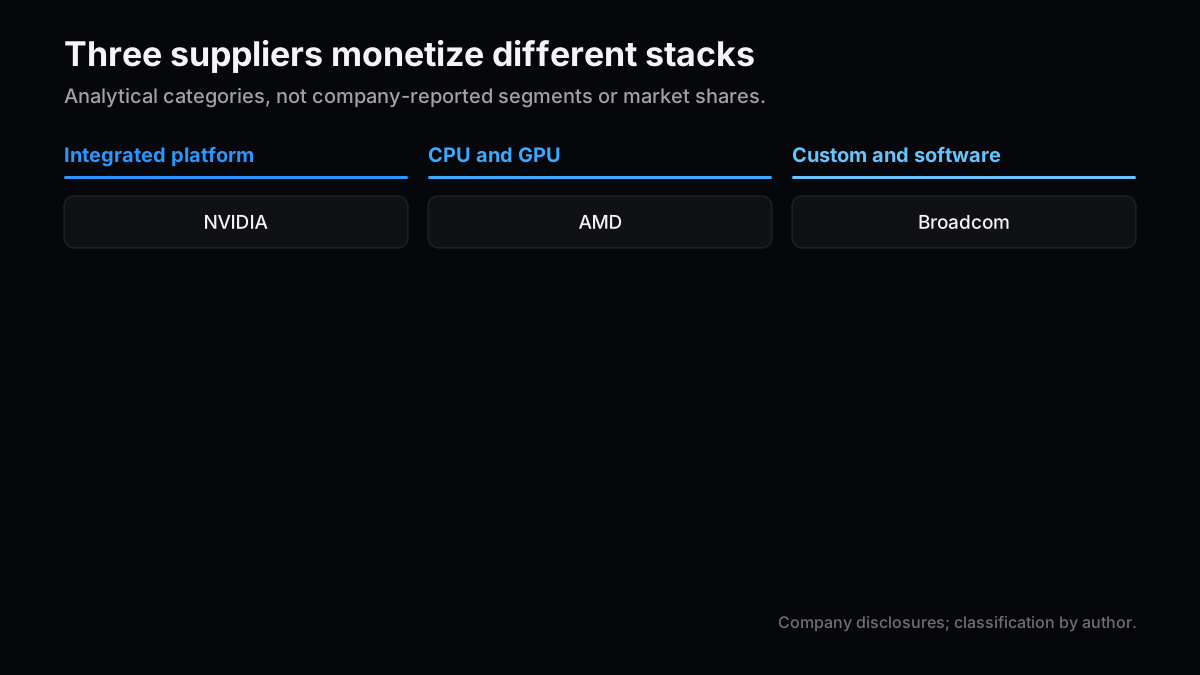
Competition increasingly spans systems rather than individual accelerators. I organize the business models as follows. These are analytical categories, not reported segments.
| Supply model | Main company | Customer priorities | Investor priorities |
|---|---|---|---|
| Integrated GPUs and networking | NVIDIA | Deployment speed, software and utilization | Durable margins and cash collection |
| A combined CPU and GPU alternative | AMD | Compatibility, migration effort and total cost | Data Center mix and profitability |
| Custom AI silicon and connectivity | Broadcom | Optimization for large, stable workloads | Customer concentration and other cash engines |
Custom-silicon growth does not automatically imply the disappearance of general-purpose GPU demand. Stable workloads may justify specialization, while rapidly changing models may reward flexibility. That is a hypothesis about workload allocation. Three companies' quarterly revenue cannot establish the final split.
Lower inference prices are similarly ambiguous. If usage rises faster than unit prices fall, compute demand can expand. If customers capture nearly all the efficiency gain through lower prices, supplier margins can compress. I want to track demand and pricing power independently instead of treating either outcome as inevitable.

Positive on the Business, Neutral on the Stock Without a Price Test
NVIDIA's growth and profitability support a positive medium-term business view. They do not, by themselves, establish that the current share price is attractive. The company's next-quarter revenue outlook of $108.0 billion and gross-margin outlook of 74.0% are forecasts, not reported results.
For the next two to four quarters, these are the conditions that would guide my assessment. I assign neither probabilities nor price targets to them.
| Scenario | Evidence to observe | Earnings and cash implications | Assessment |
|---|---|---|---|
| Base case | Revenue grows while receivables growth slows | Collection catches up | Positive on business; stock depends on price |
| Main upside | Inference demand and utilization improve together | Margins hold and FCF rises | Grounds for a stronger assessment |
| Tail risk | Customer funding and deployment both weaken | Receivables and inventory persist as margins fall | Reduce growth assumptions |
What would change my mind: several quarters of deteriorating cash collection alongside falling gross margins. Conversely, collection normalizing while margins remain high would support interpreting the current gap as a temporary cost of growth.
The next release needs to answer more than whether revenue guidance was met. Receivables, inventory, customer financing and profit excluding investment effects all deserve attention. Strong products and rising distributable cash need to converge again before I become more confident about the economics shareholders receive.
Related Posts
- AI Chip Investments 1: Three Layers of Capital Strategy — Connecting customer and supplier investments to cash collection.
- AI Chip Earnings 2: The Challenger Cash Test — A closer look at AMD inventory and FCF.
- Post 76: How Policy Reaches Stocks — The preceding discussion of power and funding constraints.
References
- NVIDIA FY2027 Q2 results and reconciliations, August 26, 2026
- NVIDIA FY2027 Q2 Form 10-Q
- AMD 2026 Q3 results, November 3, 2026
- Broadcom FY2026 Q3 results, September 2, 2026
Next Issue Ideas
- Idea 1: Semiconductor Profits When Inference Prices Halve — Compare GPUs, custom silicon and networking under different usage responses.
- Idea 2: When Does AI Equipment Turn Into Cash? — Follow receivables and prepayments across at least three suppliers over two quarters.
- Idea 3: Who Bears a Delayed Power Connection? — Examine inventory exposure across chip, cloud and equipment-financing contracts.
This article is not investment advice. The author may hold securities mentioned. Generative AI assisted its preparation. Please read the disclaimer before making an investment decision.