Did Your Portfolio Grow, or Did the Yen Just Fall? Three Places a Home Spreadsheet Quietly Goes Wrong
Buy $10,000 of US stocks at ¥110 and hold at $10,000 with the rate at ¥150: the stocks did not grow, yet yen shows +36%. Three places a home spreadsheet goes wrong, and how to fix them.

Buy $10,000 of US stocks at ¥110 and hold at $10,000 with the rate at ¥150: the stocks did not grow, yet yen shows +36%. Three places a home spreadsheet goes wrong, and how to fix them.

The amounts are examples for the math, and the exchange rates are not actual rates. The tax notes are general and use Japanese rules, so please check with a tax adviser or your broker for your own case. Checked as of October 31, 2026 (Asia time).
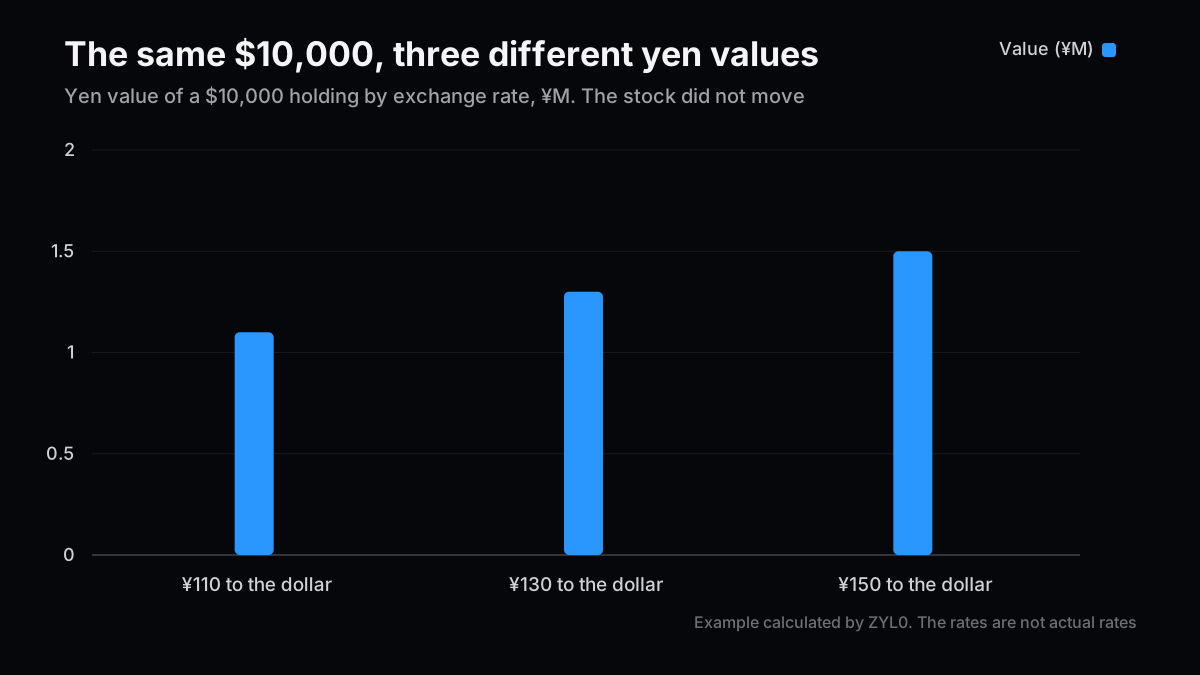
Say you bought $10,000 of US stocks at ¥110 to the dollar. They are still worth $10,000, and the rate is now ¥150.
In yen, ¥1.1M has become ¥1.5M. That is up 36%. And yet your stocks have not gained a single dollar.
Numbers like this slip quietly into home-made investment spreadsheets. Japan's Financial Services Agency counted 28.2 million NISA tax-free accounts at the end of December 2025, with ¥18.7 trillion invested during 2025. A broker's screen does not cover everything, so plenty of people must be keeping their own Google Sheets or Excel file.
I invest in US stocks myself, so this is not someone else's problem. No. 73 and No. 74 were about what companies and stakes are worth. This one is about your own money. There are three easy places to go wrong, and in all of them the cell shows a perfectly reasonable number.
One: Did the Stock Grow, or the Exchange Rate?
Let's look at that opening example more carefully.
| View | When bought | Now | Change |
|---|---|---|---|
| In dollars | $10,000 | $10,000 | 0% |
| In yen, at the purchase-day rate | ¥1.1M | ¥1.5M | +36% |
| In yen, recalculated at today's rate | ¥1.5M | ¥1.5M | 0% |
The third row is the nasty one. If your sheet has a single exchange-rate cell and even your cost is calculated from it, your past gain in yen simply disappears. Nobody ever decided that. It just happens.
Look only at the second row, and you will credit your investing for what the weak yen did. The same $10,000 is ¥1.3M at ¥130. The stock has not moved, and you appear to be down ¥200,000.
This affects tax too. In Japan, gains on foreign stocks are basically calculated by converting the purchase and the sale into yen, each at its own day's rate.
Suppose that outside a NISA you buy $10,000 at ¥110 and sell at $9,500 when the rate is ¥150. You lost 5% in dollars. In yen, ¥1.1M became ¥1.425M, a ¥325,000 gain. At a tax rate of about 20%, that is about ¥66,000 in tax. You lost money in dollars and still owe tax. Bank spreads and fees shift the numbers a little, but that is how it works.
Running this example gave me a small chill. If you only watch the dollar screen, you will miss that tax entirely.
The fix is simple: keep the purchase-day rate in its own column, and show gains in both dollars and yen.

Two: Buying More Throws Off Your Profit
If you buy regularly or add to a position, this is where things drift next.
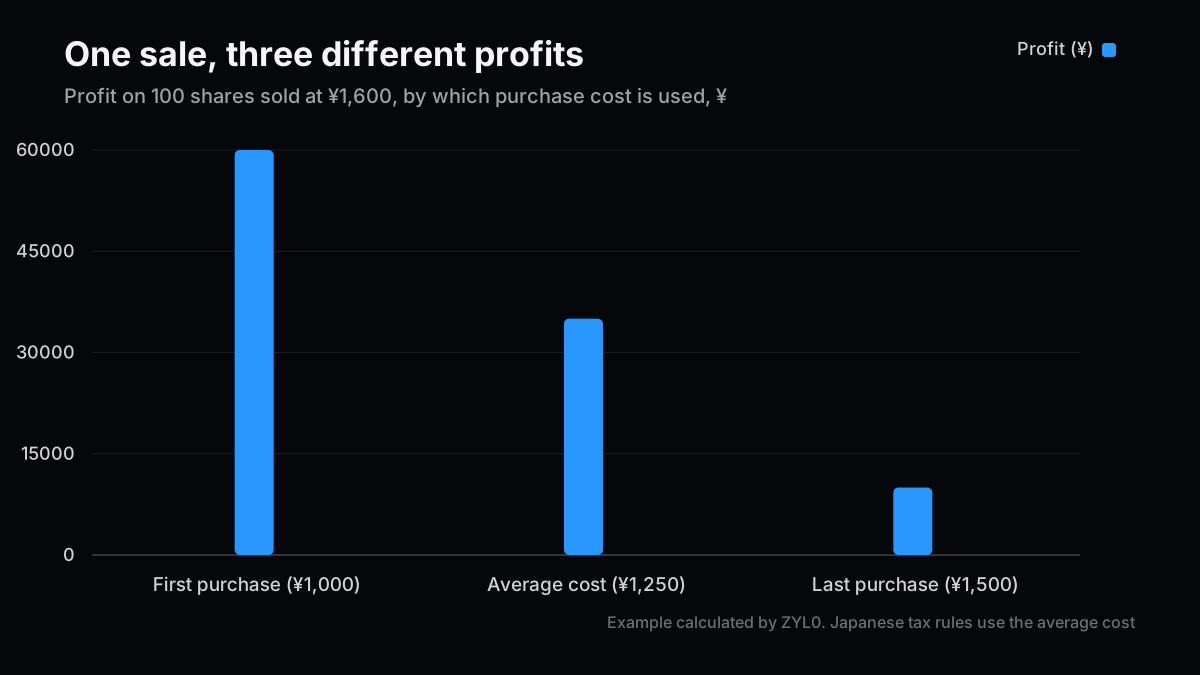
Say you buy the same stock twice and sell part of it. You buy 100 shares at ¥1,000 and another 100 at ¥1,500. Then you sell 100 at ¥1,600. What is your profit?
| How you calculate it | Cost per share | Profit on 100 shares |
|---|---|---|
| Using the first purchase | ¥1,000 | ¥60,000 |
| Using the average cost | ¥1,250 | ¥35,000 |
| Using the last purchase | ¥1,500 | ¥10,000 |
One sale, and the profit differs sixfold. Under Japan's National Tax Agency rules, shares of the same stock bought at different times use an averaging method. So the right answer is the middle one, ¥35,000.
The usual pattern in a home-made sheet, I think, is one cost cell that gets overwritten with each purchase, or never updated at all. If you use a broker's tax-managed account, the broker does the calculation, so you will rarely get into trouble at tax time. But your sheet stops matching the broker's screen, and you can no longer tell which is right.
Shares in a tax-managed account and those outside it are also calculated separately, even for the same stock. If you have several accounts, you need an account column too.

Three: Counting Your Own Deposits as Growth
I suspect this one is the most common.
Put in ¥50,000 a month and your assets rise ¥600,000 in a year, even if prices never move. The "my assets" chart climbs beautifully, but what grew was your own money.
The opposite mistake exists too. Say you sell ¥1M of a holding worth ¥4M and keep the cash.
| Item | Correct | Sale not reflected |
|---|---|---|
| Stock value | ¥3M | ¥4M |
| Cash from sale | ¥1M | ¥1M |
| Total | ¥4M | ¥5M |
Forget to reduce the holding and you look ¥1M richer. One missed entry inflates your total by 25%.
Checking takes two steps.
First, compare the shares and cash in your sheet with your broker's screen. That is where a missed sale shows up. No amount of re-checking the sheet's own math will find it.
Once those match, work out what really grew.
What actually grew = assets today − total deposited + total withdrawn
Now you can finally see whether your investing made money or you just put more in. I think this one line is the most useful thing in the whole sheet. It will not catch mistakes, though, so matching the balances has to come first.

How to Build a Sheet That Is Harder to Get Wrong
What the three share is overwriting the latest value.
Research on spreadsheet errors is harsher than you might expect. Raymond Panko's summary reports errors in at least 86% of spreadsheets in newer field audits, and Powell and colleagues' 2009 audit found errors in 0.9-1.8% of formula cells. None of this measured household sheets directly, but ten stocks, three items and twelve months is 360 cells a year, so a few mistakes would be no surprise.
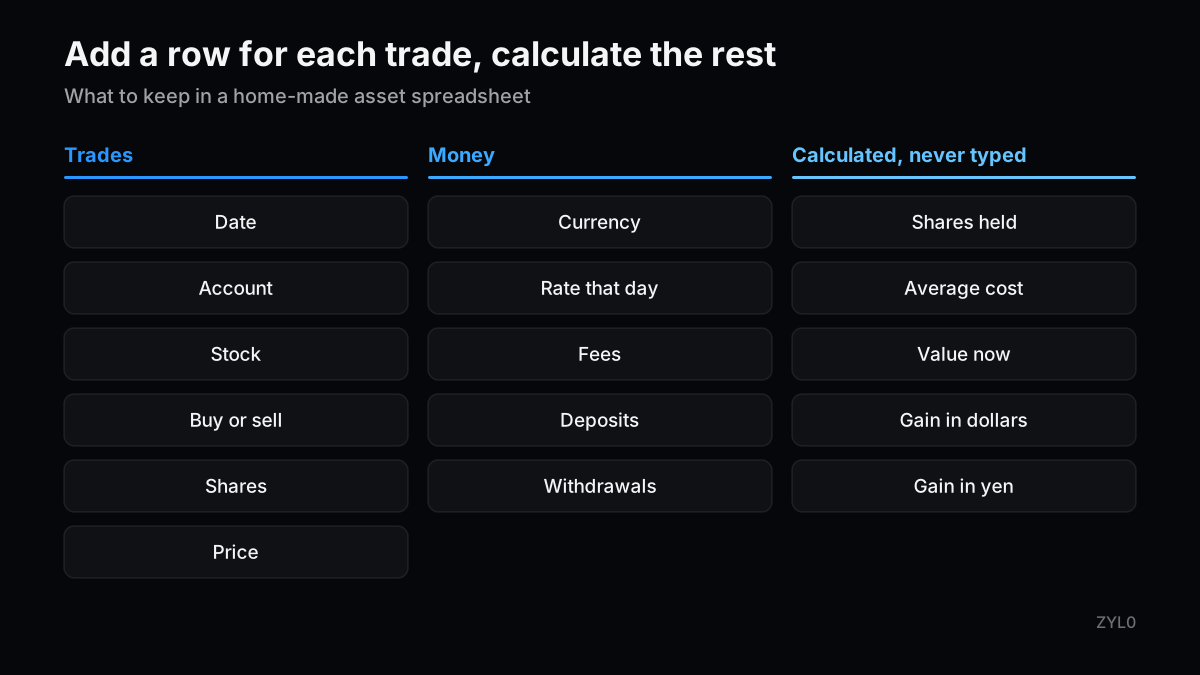
So rather than aiming for zero mistakes, build something where you can catch them. The trick is to add each trade as its own row and calculate balances from those rows.

| Type | Columns | How to handle it |
|---|---|---|
| Trades | Date, account, stock, buy or sell, shares, price | Add a row each time |
| Money | Currency, that day's rate, fees, deposits and withdrawals | Add a row each time |
| Calculated | Shares held, average cost, value now, gain in dollars, gain in yen | Never type these |
Then, once a month, compare shares, cost and cash against your broker's screen. If they do not match, suspect the sheet. That alone catches most of these three mistakes.
And who should not bother? If you just have one index fund on a monthly plan, you do not need a sheet. Your broker's screen is plenty, and I would spend that time reviewing how much you put in. This is for people who want one view across several accounts or currencies.
Having AI check a spreadsheet should become more common. Even so, I do not think you can say "the AI looked, so it is right" just yet. If the original number was overwritten, the AI cannot know either.
Related Posts
- Who Decides a Startup Is Worth a Trillion Yen? — What a company is worth, worked on a ramen shop
- A 1% Stock Option Thins to 0.63% After Three Funding Rounds — How stakes thin out, and a rough take-home figure
References
- NISA Account Usage (Dai-ichi Life Research Institute, report on the FSA survey)
- No.1466 Cost of Shares Bought More Than Once (National Tax Agency, Japan)
- No.1463 Tax on Share Transfers (National Tax Agency, Japan)
- Commentary on Converting Foreign-Currency Transactions (National Tax College, Japan)
- Spreadsheet Errors: What We Know. What We Think We Can Do (Raymond Panko)
- Errors in Operational Spreadsheets (Powell, Baker, Lawson, 2009)
Next Issue Ideas
- Idea 1: Why Do Prices Fall Right After Listing? — Reading the gap between private valuations and post-IPO share prices from public information.
- Idea 2: Five Numbers to Check Before Joining a Startup — Cash left, sales growth, the gap between rounds, and other figures you can check from outside.
- Idea 3: I Had AI Check My Asset Spreadsheet — What it catches and what it misses, tested on a sheet with mistakes planted on purpose.
This post is not investment or tax advice. The author may hold securities of the companies mentioned. Generative AI was used in preparing it. Please read the disclaimer before making any investment decision.