AI Valuation 1: 24% of Revenue, 75% of Value Against an Eleven-Company SaaS Basket
Compare a private AI round valuation with the combined market value and trailing revenue of eleven SaaS-focused S&P 500 constituents, testing the growth required to support the premium.

Compare a private AI round valuation with the combined market value and trailing revenue of eleven SaaS-focused S&P 500 constituents, testing the growth required to support the premium.

Anthropic's disclosed $965 billion round valuation equals approximately 75% of the combined market value of this article's eleven-company SaaS basket. Its latest trailing revenue equals approximately 24% of their combined revenue. That implies a 3.1-times sales-multiple premium, which is substantial but does not by itself prove overvaluation.
This public-information comparison was checked on November 7, 2026. Anthropic's May 28 post-money valuation is held constant as a sensitivity; listed market values use November 6 regular-session closing data. This is not a current private-market quote or a confirmed IPO price.
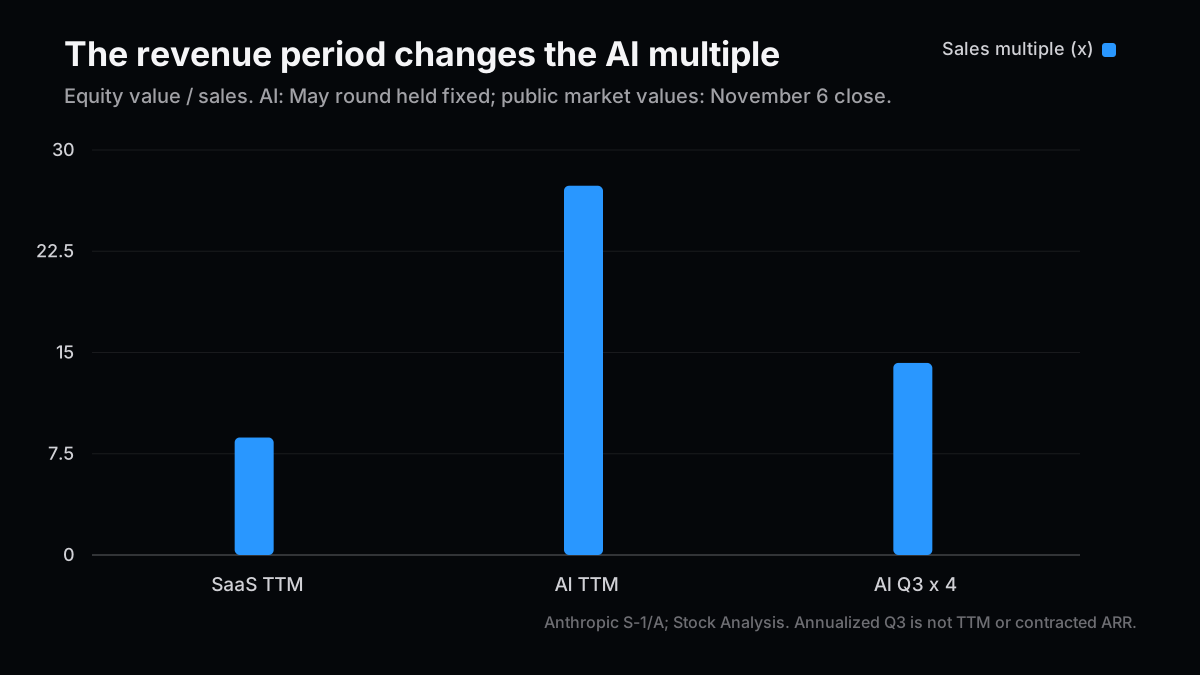
Post 75 argued for preserving assumptions behind plausible-looking numbers. Here, changing the denominator from trailing revenue to an annualized quarter nearly halves the apparent multiple.
Fix the SaaS Comparison Set Before Calculating
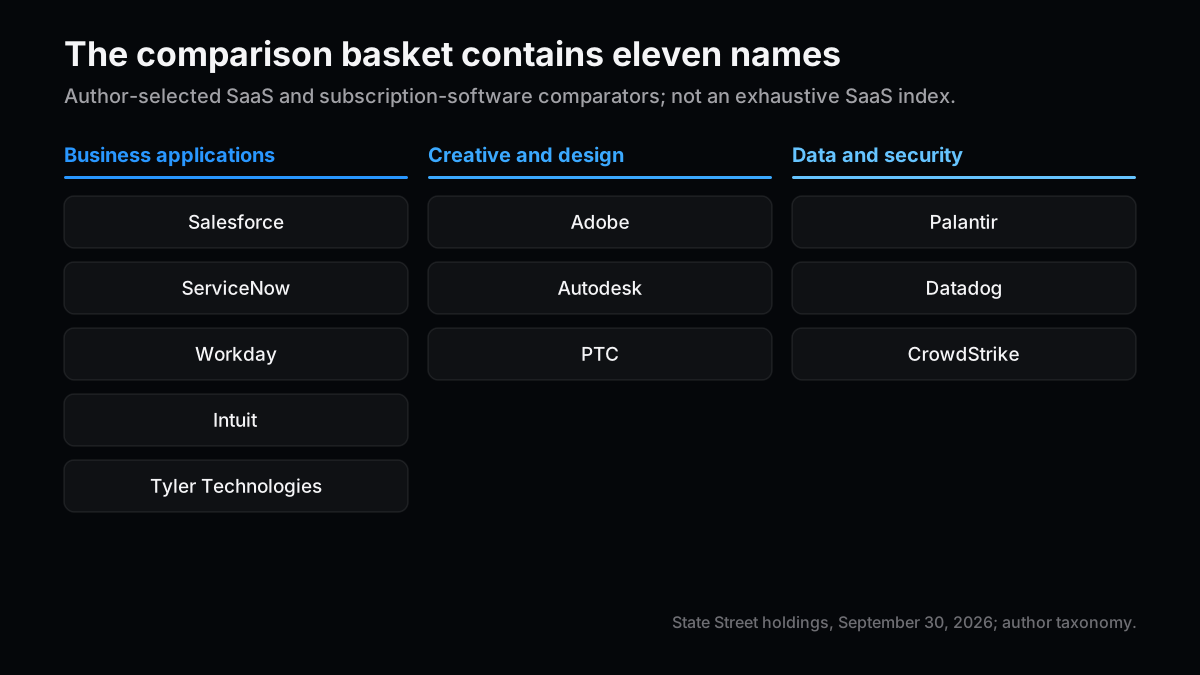
SaaS-focused is not a standalone official S&P industry. I select eleven businesses spanning recurring enterprise applications, creative and design software, business data, observability and cloud-delivered security. Microsoft, Oracle and businesses with substantial other operations are excluded. This is an explicitly selected basket, not an exhaustive official total of all SaaS-related S&P 500 companies.
Membership scope is cross-checked against State Street's September 30, 2026 S&P 500 tracking-fund holdings. Market values use November 6 data; revenue uses each company's latest available TTM. Reporting endpoints differ, so this is not an exactly matched calendar-period comparison.
Amounts are USD billions. Market values and TTM revenue use Stock Analysis's displayed figures, rounded to two decimals before aggregation. Company links lead to the individual observations.
| Company | Market value | TTM revenue | Sales multiple | TTM endpoint |
|---|---|---|---|---|
| Salesforce | 175.83 | 43.94 | 4.00x | July 2026 |
| ServiceNow | 105.84 | 15.43 | 6.86x | September 2026 |
| Adobe | 93.14 | 25.97 | 3.59x | August 2026 |
| Intuit | 91.26 | 21.45 | 4.25x | July 2026 |
| Autodesk | 54.70 | 7.79 | 7.02x | July 2026 |
| Workday | 46.49 | 10.16 | 4.58x | July 2026 |
| CrowdStrike | 222.57 | 5.40 | 41.22x | July 2026 |
| Datadog | 64.64 | 4.28 | 15.10x | September 2026 |
| Palantir | 386.44 | 7.29 | 53.01x | September 2026 |
| PTC | 21.17 | 2.73 | 7.75x | September 2026 |
| Tyler Technologies | 16.72 | 2.48 | 6.74x | September 2026 |
| Total | 1,278.80 | 146.92 | 8.70x | Latest available TTM |
The aggregate multiple is total market value divided by total revenue, not the arithmetic average of individual multiples. It uses whole-company values and consolidated revenue, not isolated SaaS segments. Share-count updates also differ between data vendors, which is why market values are not mixed across websites.

Rebuild Anthropic's Denominator as TTM
The November 2 S-1/A reports $4.585 billion of 2025 revenue, $2.545 billion for the first nine months of 2025, and $33.242 billion for the first nine months of 2026. Trailing revenue through September is therefore 4.585 − 2.545 + 33.242 = $35.282 billion.
Multiplying the latest quarter's $16.956 billion by four produces $67.824 billion. That is an annualized quarter, not trailing revenue, realized annual revenue or contracted ARR. It helps describe the latest operating scale under a continuation assumption.
| Measure | USD billions | Nature |
|---|---|---|
| 2025 revenue | 4.585 | Reported annual result |
| January–September 2026 revenue | 33.242 | Reported nine-month result |
| TTM through September 2026 | 35.282 | Calculated from reported periods |
| Q3 multiplied by four | 67.824 | Annualization sensitivity |
| Disclosed May round valuation | 965.0 | Historical post-money valuation |
The resulting 965 ÷ 35.282 is 27.35x, versus the basket's 8.70x: a 3.14-times premium. The same inputs produce value equal to 75.5% of the basket and revenue equal to 24.0%.
Private round values nevertheless involve share classes, preferences, conversion mechanics and new financing. They are not the same security as listed common equity. The S-1/A's capital structure cannot be ignored when interpreting the headline value as a price available to ordinary investors.
A 14x or a 27x Multiple Should Not Be Chosen to Fit the Thesis
Holding valuation constant but using the annualized quarter gives 14.23x. Rapid growth explains the difference. Choosing only the lower denominator-based multiple to claim cheapness is as unconvincing as using only the higher one to forecast a collapse.
The $1.5 trillion and $2 trillion rows below are hypothetical pricing sensitivities, not a company-confirmed IPO range.
| Assumed equity value, USD billions | Multiple of TTM revenue | Multiple of annualized Q3 |
|---|---|---|
| 965 | 27.35x | 14.23x |
| 1,500 | 42.51x | 22.12x |
| 2,000 | 56.69x | 29.49x |
Annualized Q3 and the SaaS basket's TTM use different denominator periods, so I do not treat a direct comparison between those two as the formal relative valuation. The main comparison is TTM against TTM. Annualization illustrates Anthropic's changing scale.

In an earlier follow-on investment assessment, I had to separate confidence in a business from confidence in its proposed price. A technology can be promising while the growth embedded in the security is too demanding. I apply that distinction here: product quality and equity value need separate arguments.

Growth Must Eventually Deliver Shareholder Earnings
Supporting $965 billion at the basket's 8.70x multiple would require approximately $110.9 billion of TTM revenue, or about 3.14 times the current figure. This is a reverse calculation at a fixed multiple, not a fair-value forecast.
For another illustration, a $2 trillion equity value, a hypothetical 25% net margin and a 30x earnings multiple imply revenue of roughly $266.7 billion: 2,000 ÷ 30 ÷ 25%. Neither the margin nor the earnings multiple is company guidance. The exercise makes the eventual earnings requirement explicit.
The filing reports positive operating cash flow of $6.6 billion for the first nine months of 2026. Large net losses cannot simply be relabeled cash burn: substantial financing-related fair-value changes are included. Equally, non-cash losses do not remove the economic significance of large compute commitments.
Compute and infrastructure expense also includes different activities, including training and inference. Subtracting that combined line from revenue does not automatically produce a gross margin comparable with a conventional SaaS disclosure. Applying a software multiple without aligning the earnings definition risks overstating profitability.
Private-market funding reinforces the context. Sequoia and other investors co-led the May Series H. Carta reports that approximately 57% of Series B-and-later capital in 2026 went to AI businesses on its platform. Those observations show concentrated expectations, not a guarantee of a future public price.
The Basket Itself Changes the Result
Excluding Palantir lowers the remaining ten-company aggregate multiple to approximately 6.39x. Including it therefore makes Anthropic's relative premium smaller. At the individual-company level, both Palantir and CrowdStrike exceed Anthropic's TTM multiple. Claiming Anthropic trades above every SaaS comparator would be false.
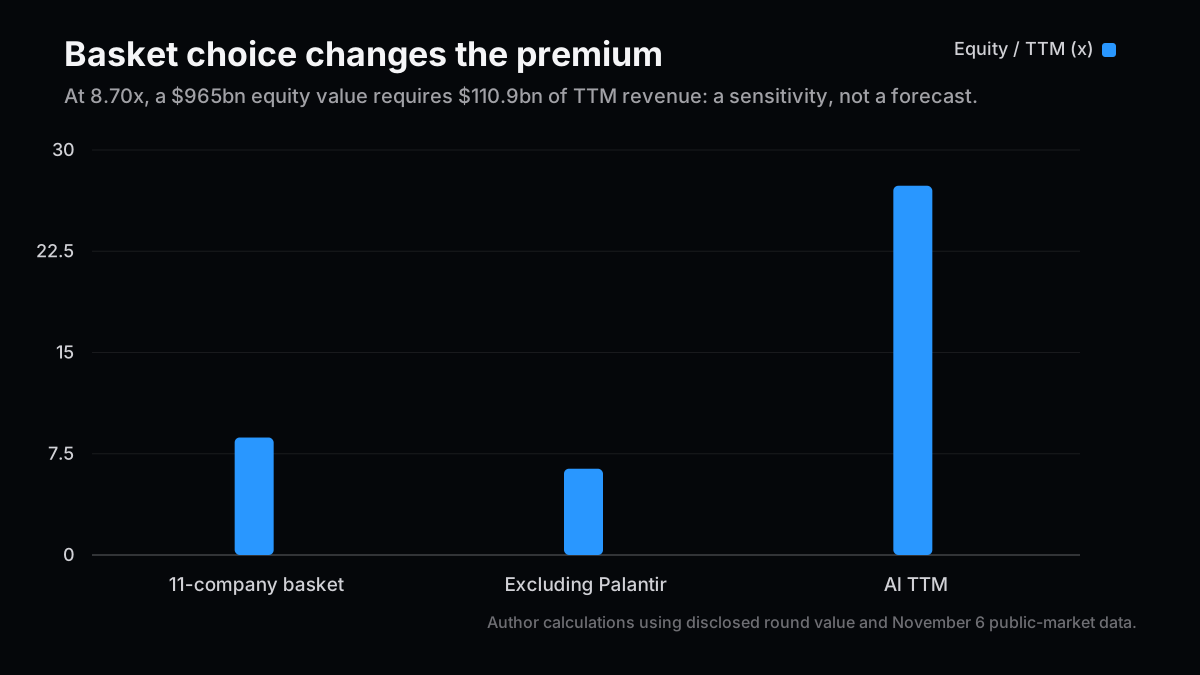
What the comparison establishes is a substantial premium against the specified aggregate. Whether that premium is excessive depends on future growth, retention, profitability, capital requirements and share terms. My assessment is that the margin for execution error is limited. A multiple gap alone is insufficient for a categorical bearish trade.

Demanding Expectations, With Evidence Still to Come
| Scenario | Observable conditions | Reading of the premium | Assessment |
|---|---|---|---|
| Base case | Growth remains high while capital needs expand | Support and burden coexist | Cautious at demanding prices |
| Main upside | Revenue and sustainable cash earnings scale together | Growth reduces the multiple | Weaken the overvaluation hypothesis |
| Tail risk | Growth slows while funding requirements rise | The growth premium contracts | Material repricing risk |
What would change my mind: revenue approaches the reverse-calculated scale while cash earnings attributable to shareholders rise sustainably. A high-looking current multiple could then have been a reasonable anticipation of future profit.
The next disclosure needs to connect revenue, security terms, repeat usage, research and inference costs, and cash commitments. Sales multiples start the discussion. They do not complete it.
Related Posts
- AI Valuation 2: How an IPO Delay Reaches Markets — Conditions for transmission to partners and listed shares.
- Three Places an Asset Spreadsheet Goes Wrong — Why denominators and assumptions must remain visible.
- AI Chip Investments 2: Conditional Customer Capital — Investment alongside purchasing relationships.
References
- Anthropic S-1/A: revenue, capital structure and cash flow, November 2, 2026
- Anthropic Series H valuation and co-leads, May 28, 2026
- State Street S&P 500 Index V.I.S. Fund holdings, September 30, 2026
- Salesforce primary results, ServiceNow primary results, Datadog primary results
- Stock Analysis data-provider and update notes — Individual price and TTM links appear in the table; market data is fixed at the November 6, 2026 close.
- Carta State of Private Markets Q3 2026
Next Issue Ideas
- Idea 1: When Valuation Moves From Sales to Earnings — Compare required revenue and margins across three AI and software groups.
- Idea 2: How Durable Is Usage-Based Revenue? — Compare committed revenue, minimum purchases and realized usage at three or more businesses.
- Idea 3: What Changes in the IPO Share Terms? — Translate private-round headlines into the economics of common equity.
This article is not investment advice. The author may hold securities mentioned. Generative AI assisted its preparation. Please read the disclaimer before making an investment decision.