US Stocks at Year-End Gained in 18 of 25 Seasons and Beat the Prior Window 11 Times
US stocks rose an average 0.64% in the Santa window over the latest 25 seasons, beating the prior seven sessions 11 times. Fifty years of daily data put that window and the January size effect side by side.

US stocks rose an average 0.64% in the Santa window over the latest 25 seasons, beating the prior seven sessions 11 times. Fifty years of daily data put that window and the January size effect side by side.
Over the 25 seasons through January 2026, US stocks returned +0.64% on average in the seven trading sessions spanning the new year and rose in 18 of those seasons. They averaged +0.48% in the preceding seven sessions, which the year-end window beat just 11 times. The January return gap between small and large stocks was also sensitive to where I drew the size cutoff.
Eighteen up seasons caught my eye. I wanted to know what that number would look like beside a window of the same length a few sessions earlier in December. In the October CPI article, I put changes over different horizons in separate columns. A few sessions can change the sign of the headline return.
What counts as a Santa trading session?
The Stock Trader's Almanac defines the Santa Claus rally as the last five trading sessions of the year and the first two in January. I compound the daily returns across those seven observations. With closing values, the measurement starts at the sixth-to-last December close and ends at the second January close. This includes the return on the first session in the window. Holidays with no trading contribute no observations. Shortened sessions with closing data count as sessions. Stock Trader's Almanac
| Window | Sessions included | What it measures |
|---|---|---|
| Santa window | Final five in December and first two in January | Seven-session return across the year boundary |
| Prior seven sessions | Twelfth-to-last through sixth-to-last December sessions | A same-length, non-overlapping window close to year-end |
| Full January | First through last session in January | Return from the prior year-end close through the January close |
I use 50 seasons from the Kenneth French Data Library. A row marked 1977 refers to a season that began in December 1976 and ended in January 1977. Adding the published risk-free rate, RF, back to Mkt-RF recovers the daily value-weighted market return. The universe includes eligible US common stocks on the NYSE, AMEX and Nasdaq. S&P 500 membership is a different screen. I use the FRED closing series for one separate example where the date and starting index value can be inspected directly. Market return definition and FRED SP500
How often does the window beat the week before it?
| January year | Santa average | Santa gains | Prior average | Prior gains | Santa beats prior |
|---|---|---|---|---|---|
| 1977–2026 | +1.01% | 36 / 50 | +0.62% | 33 / 50 | 22 / 50 |
| 1977–2001 | +1.38% | 18 / 25 | +0.76% | 16 / 25 | 11 / 25 |
| 2002–2026 | +0.64% | 18 / 25 | +0.48% | 17 / 25 | 11 / 25 |
The two halves had the same count of gains, with an average in the later half less than half the earlier figure. The season ending in January 2009 was the strongest Santa window in the later sample. Leave it out and the remaining average for that window falls to +0.34%. One large move can have a visible effect on the mean even while the count changes by a single observation. For a comparison between similarly short holding periods, I would want both figures in view.
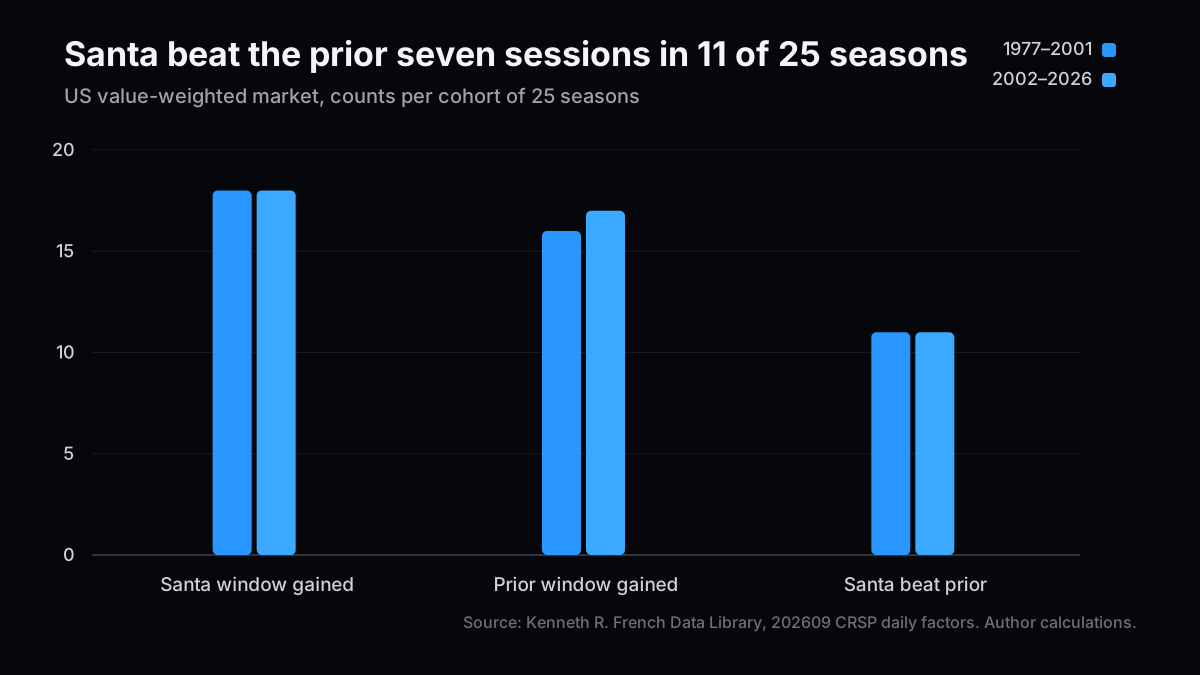
When I helped standardize assessment criteria for an investment team, we first had to agree on what each label measured. Here, a gain and a gain that exceeds an alternative window each deserve a column. The preceding seven sessions may have their own holiday or portfolio effects. Comparing these two windows cannot isolate what the turn of the year itself does. Other December windows, or windows matched on their distance from market holidays, would make for stronger checks.
A weak Santa window can coexist with a strong January
For the S&P 500 running into 2026, the Santa window returned −0.11% and the full January returned +1.37%. The daily closes show exactly where the measurements diverge.
| FRED SP500 close | Index level | Role in the calculation |
|---|---|---|
| December 23, 2025 | 6,909.79 | Starting value for the Santa window |
| December 31, 2025 | 6,845.50 | Starting value for all of January |
| January 5, 2026 | 6,902.05 | Ending value for the Santa window |
| January 30, 2026 | 6,939.03 | Ending value for all of January |
I divide the ending level by the starting level and subtract one. These are price returns, excluding dividends. In the broad market series the Santa and full-January returns had different signs in 10 of the latest 25 seasons. The windows share the first two trading days in January. The broad market's average monthly January return in those 25 seasons was +0.28%. The mean across the 250 February-through-November monthly returns in the year preceding each January was +0.89%. That descriptive comparison leaves December out and makes no adjustment for different levels of volatility or the market backdrop across months. FRED daily closing values

Where in the size distribution does January show up?
Donald Keim's 1983 study found that the risk-adjusted return differences associated with firm size on the NYSE and AMEX were concentrated in January, particularly near the start of the month. I check a narrower question using raw returns. For each January, I subtract the return of a large-stock portfolio from the return of a small-stock portfolio, then change the cutoffs to see whether the gap carries over to wider groups. Keim (1983), sections 3 and 5
| January year | Smallest 10% minus largest 10%, mean | Median | Positive seasons | Smallest 30% minus largest 30%, mean |
|---|---|---|---|---|
| 1977–2001 | +4.51 pp | +3.26 pp | 20 / 25 | +2.67 pp |
| 2002–2026 | +1.58 pp | +0.45 pp | 14 / 25 | +0.24 pp |
| 2017–2026 | +0.96 pp | −2.15 pp | 4 / 10 | +0.11 pp |
The mean is still positive in the latest ten seasons. The median is negative and the small-stock decile came out ahead four times. The same ten seasons give an average decile spread of +1.15 percentage points during the first two sessions of January and −0.25 percentage points from the third session through month-end. Each spread is a difference of compounded returns for that window. Adding the two spreads will not reconstruct the monthly spread.
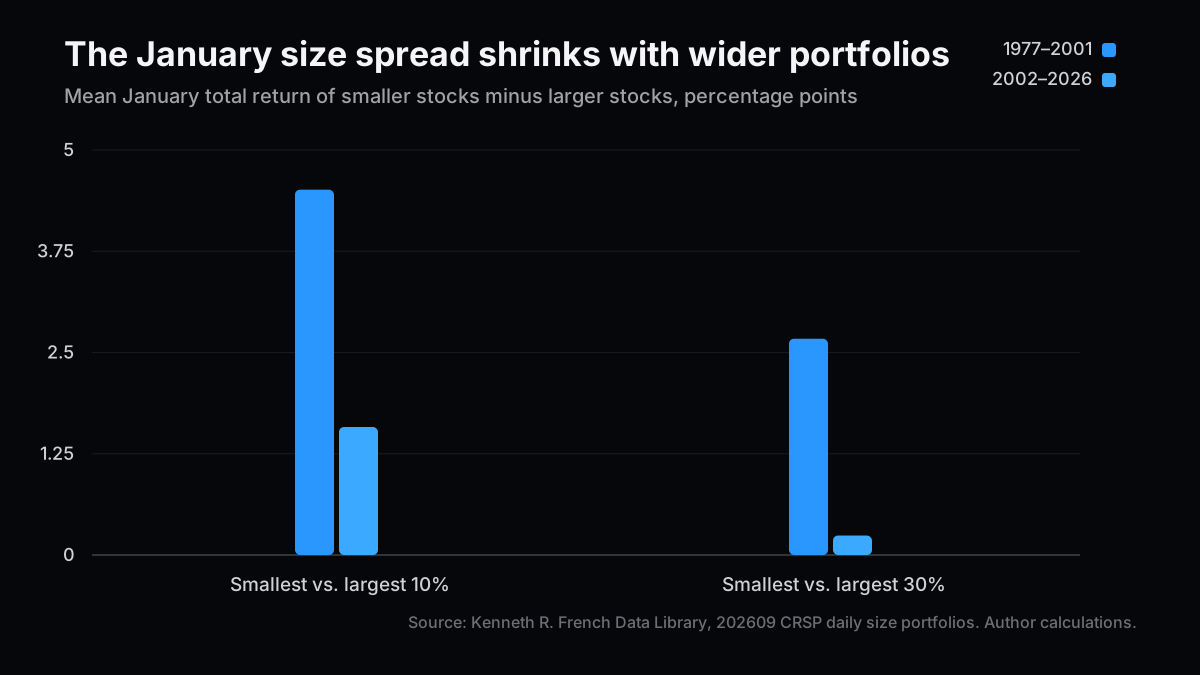
French's size portfolios are formed at the end of each June using market capitalization and breakpoints based on NYSE stocks. The 10% and 30% labels refer to groups defined by those breakpoints. The return within each group is value-weighted. A result concentrated in the lowest decile would need a separate check against the holdings and execution costs of any product meant to capture it. Size portfolio construction
What evidence would support tax-loss selling?
The hypothesis is that some investors realize losses before year-end, putting pressure on the shares they sell. After that selling subsides, the shares may recover. Keim discusses tax-loss selling and the timing of new information as hypotheses with testable implications. The grouped return series used here contain neither the tax status of the seller nor each company's prior-year return. They cannot establish who sold or why. Keim (1983), section 4
I'd start with earlier losers, match them by size and liquidity, and see whether the names that came under pressure in December were also the ones that rebounded in January. I'd keep track of earnings announcements and guidance cuts too. They can land inside the same window and move the same stocks. Quotes and trade prices would also help answer whether a price reversal visible at the close could be captured after crossing the spread.
What would change my year-end assessment?
I give the calendar little weight on its own when evaluating broad market or small-stock exposure. I use the dates to review what moved. On an up day, I'd check how many stocks and size groups participated. On a day with a widening size gap, I'd look at the companies driving it and how deeply their shares traded.
| What the market shows | Evidence to check | Interpretation |
|---|---|---|
| Gains spread across the market | Santa window beats the prior window, with gains across size groups and sectors | Track it as a candidate calendar effect |
| Gains concentrate in the smallest stocks | The decile spread widens and the 30% or late-January spread is small | Check the companies and liquidity before extending the result to small stocks generally |
| Stocks fall across size groups | The market and the size portfolios both fall, with wider quoted spreads | Review rates, earnings and other changes that might explain the move |
I'd change my view if a separate sample with the windows and size cutoffs fixed in advance beat several comparison windows and the differences survived trading costs without leaning on a few rebound years or the smallest companies. The figures here are descriptive. They include no risk adjustment, test of statistical significance, or estimates for trading costs, taxes or currency conversion. A few years make a large difference in a ten-season subsample.
How to reproduce the numbers
- Download the two French daily CSVs below. I used the September 2026 CRSP vintage downloaded on November 18.
- Add
Mkt-RFandRFfor each date. From the firstAverage Value Weighted Returns -- Dailysection of the size file, use theLo 10,Hi 10,Lo 30andHi 30columns. Join the files on the first-column date. - For each January from 1977 to 2026, sort the prior December and current January dates in ascending order. Take the last five December rows plus the first two January rows, the seven December rows immediately before that group of five, and every January row, respectively. For each window, multiply the daily factors
1 + r / 100, subtract 1, and multiply by 100. - Compute the size spread for each season by subtracting the large-stock return from the small-stock return over the same dates. Count positive seasons and compute means and medians before rounding displayed figures to two decimals.
Related Posts
- Reading October CPI when the year-over-year figure is missing — See how the measurement period changes the interpretation.
- Three mistakes in a personal asset spreadsheet — Keep currency and the return base consistent.
- Reading the ceilings and orders in lunar transport contracts — Check the definition before comparing two published numbers.
References
- Stock Trader's Almanac, November 21, 2019, definition of the Santa Claus Rally
- Kenneth R. French Data Library, September 2026 CRSP vintage, US factor definition and daily CSV
- Kenneth R. French Data Library, same vintage, size portfolio construction and daily CSV
- S&P Dow Jones Indices via the St. Louis Fed, SP500 daily closes
- Donald B. Keim, 1983, Size-related anomalies and stock return seasonality
Next Issue Ideas
- How long do year-end losers take to rebound? Compare stocks of similar size and prior returns to separate the size effect from reversal.
- What changes from a month-end to a quarter-end? Test same-length windows elsewhere in the year and compare the result across size groups.
- Does the apparent small-stock spread cover trading costs? Use quoted spreads and execution assumptions to compare the research portfolio with products investors can buy.
This article is for informational purposes and does not constitute investment advice. The author may hold positions in some securities mentioned. Generative AI assisted in its preparation. See the disclaimer for details.